I do energy audits for small businesses and propose the installation of the Vue Gen 2 as part of the package.
For the price and the out-of-box features, it can’t be beaten.
Some customers would like a customer facing dashboard which wouldn’t have the same level of details as the mobile/web-app.
This , of course, is where things get tricky as everyone has their own idea of what should be on the dashboard.
I’ve seen the other post where someone goes through their vuegraf + grafana setup which seems nice.
I have a django webapp , postgresql database which would be my preferred platform.
I’m contemplating having a cron job run every 5 minutes using pyemvue to populate my postgresql db and then use something like plotly (or grafana cloud) to build the dashboards for each customer.
So I’m wondering about people’s thoughts on dashboard building ?
On a side note, this also give the potential for adding circuits together (which is why I entered this rabbithole)
Hi @Bpendz
Here’s a brief rundown:
1. PiZeroW with 32GB class 10 microSD
2. PiOS 5.4, fully updated
3. Install InfluxDB –
4. Install Grafana –
5. Install pip3 and supporting packages
apt install python3-pip, pip3 install pyemue, pip3 install influxdb, pip3 install influxdb-client
6. I git cloned PyEmVue to test , then git cloned vuegraf
I think i also did pip3 install -r requirements.txt from within each of the git folders to make sure i had all the requirements
7. Once i got pyemvue to pull back my data, i setup the json file for vuegraf.
8. Connect grafana to the influxdb for vue. Would probably be good to setup a reader account for grafana to the influxdb
Once everything was installed and running, i tested with pyemvue to make sure it would pull data. I then got vuegraf working as released.
Here’s where I began changing a few things:
1. I had to modify the sample JSON to get pyemvue to tag properly, or else everything showed up as the channel name\# from Vue. I can provide a sample if needed.
2. I modified a copy of pyemvue to change the logging from stdout to a log file and put in a for loop so it would run for 4.5 minutes before exiting. I still have it pulling data in the same range.
3. I created a launcher script to call my modified pyemvue script and added it to crontab running every 5 minutes
I’ve spent some time messing with my grafana dashboard to suit my needs. So far i like it. I’m working on writing something using pyemvue to just pull usage by day as i havent’ figured out how to summarize the second data up by day and show a daily view in addition to the hourly views.
If i did it over again, i probably would have spent time figuring out dockers for everything with cloud backup. The vuegraf database isn’t actually very large so far, but i’ve only had it about a week.
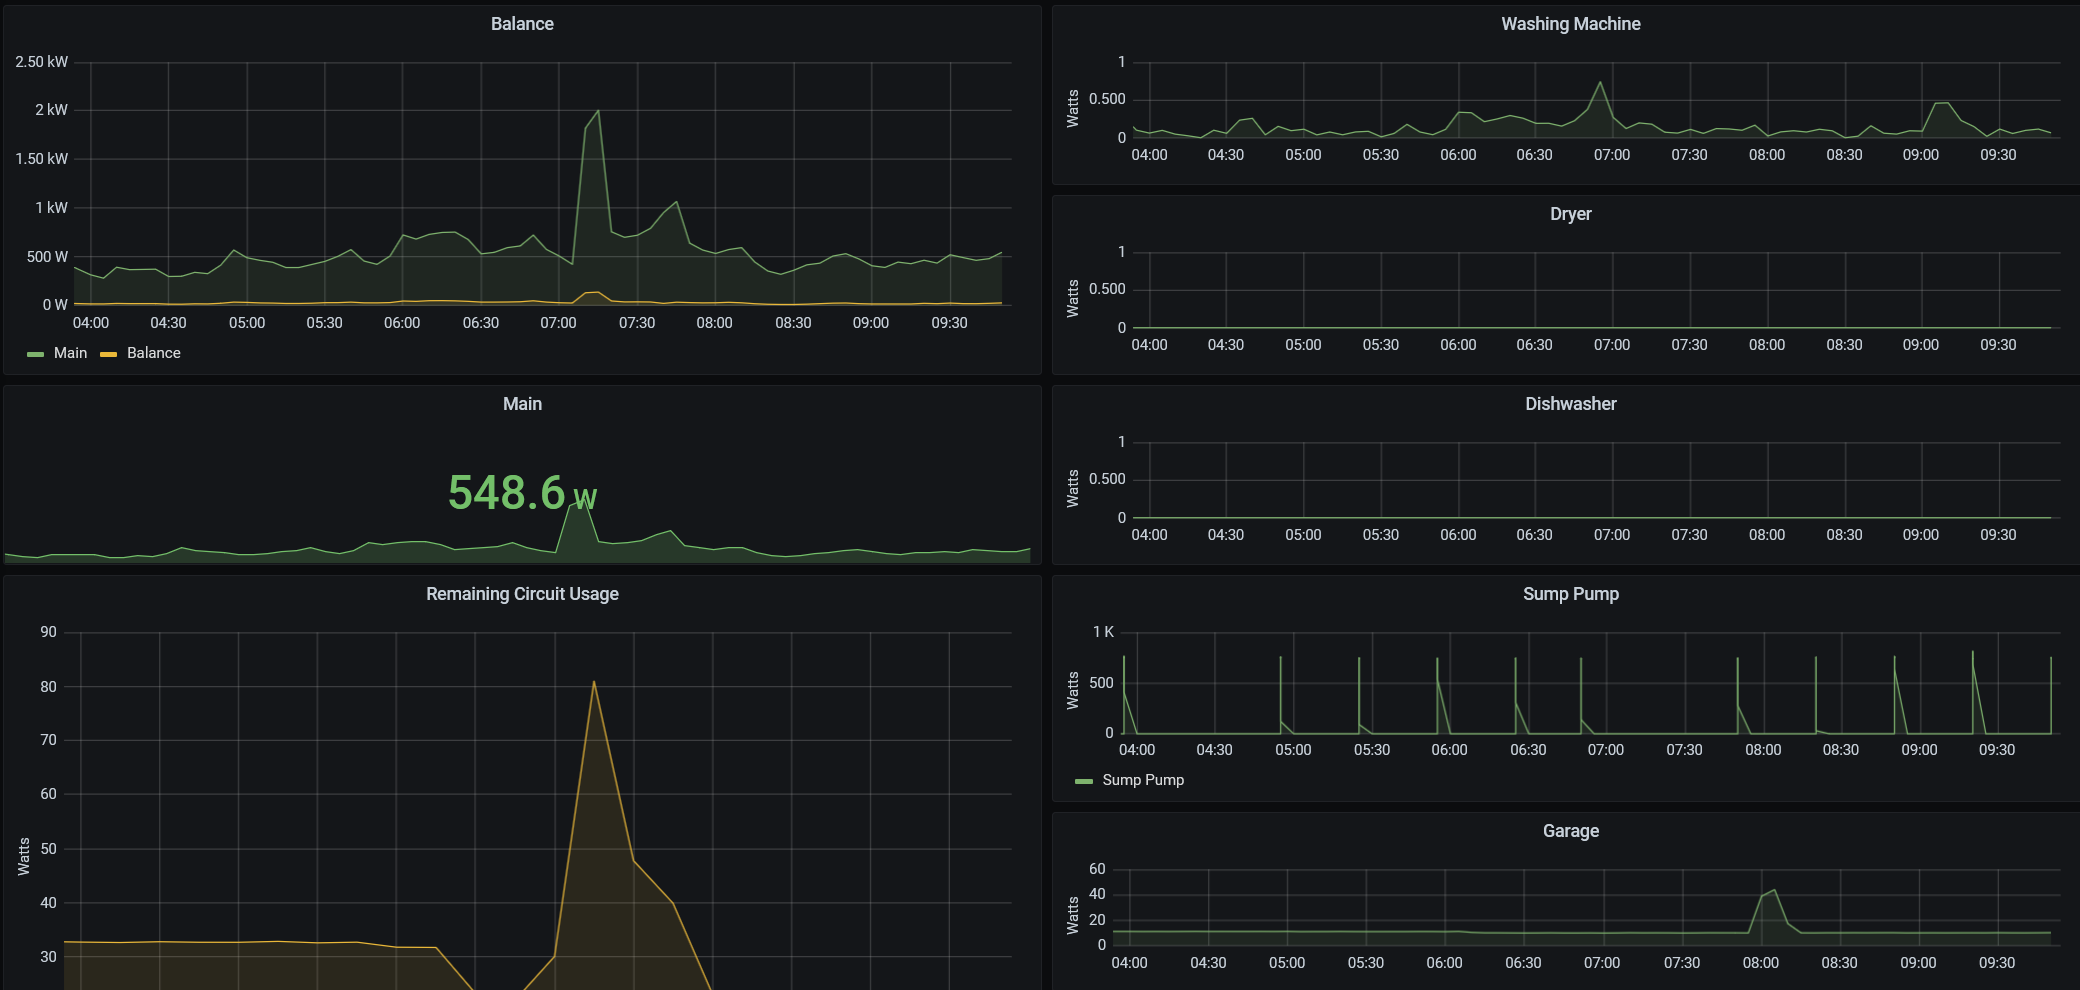
In the end i have this:


