Emporia Energy Community › Support Center › Report a Bug › Glitch / error in Minutes data reporting
- This topic has 3 replies, 1 voice, and was last updated 4 years, 3 months ago by
scrambler.
-
AuthorPosts
-
-
scrambler
MemberThere seem to be a small bug in the minute data.
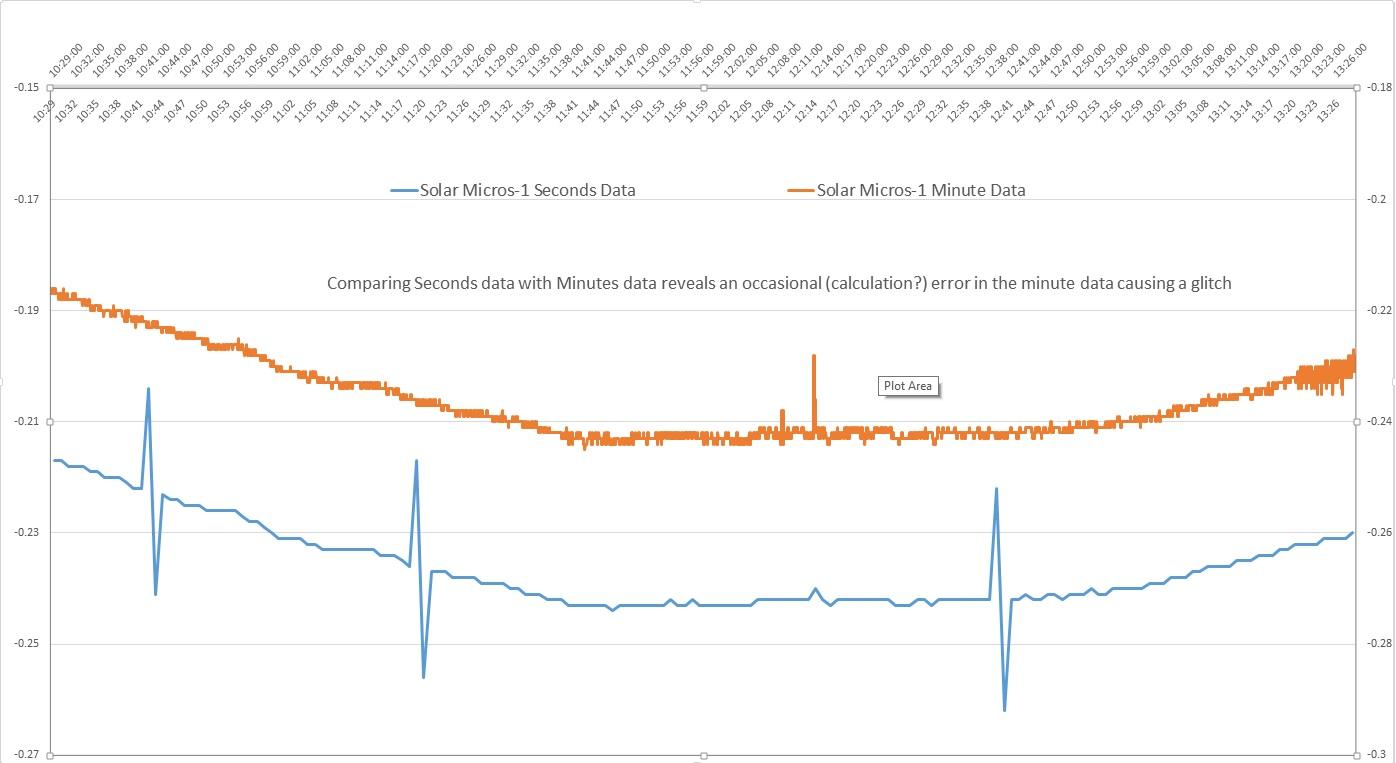
I was graphing CT values using the Minute data, and noticed an occasional glitch in the graph, at the same time, and across various CTS.
One minute dips below the curve, the next dips above then goes back to normal. Wondering if that was a measuring error or an actual glitch in the power itself, I then reviewed the seconds Data, and found out that the glitch was not present in the second data. (see graph below)

I am not sur how the minute data is calculated, but it seems there is an occasional error that cause the Minute’s Data to briefly deviate from the second’s data causing these double up / down spikes.
Checking data from other CTs at that same exact time, if the load was regular, I can see the exact same glitch across them. So it appears to affect all CTS the same way
Above is one detailed example graphed from one of the CTs on Feb 5th at 10:42, 11:19, 12:39
Let me know what you think and if you need more information.
-
scrambler
MemberFYI,
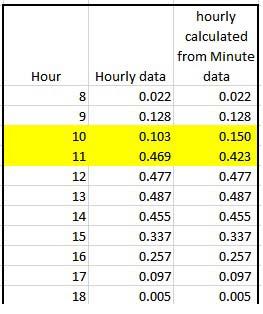
It seems the same issue is happening between Hours interval reporting and Minute interval reporting.
Sometimes the hour data will deviate from the minute data in the same way as described above. One value will be higher than it should the next below what it should, then back to normal.

-
scrambler
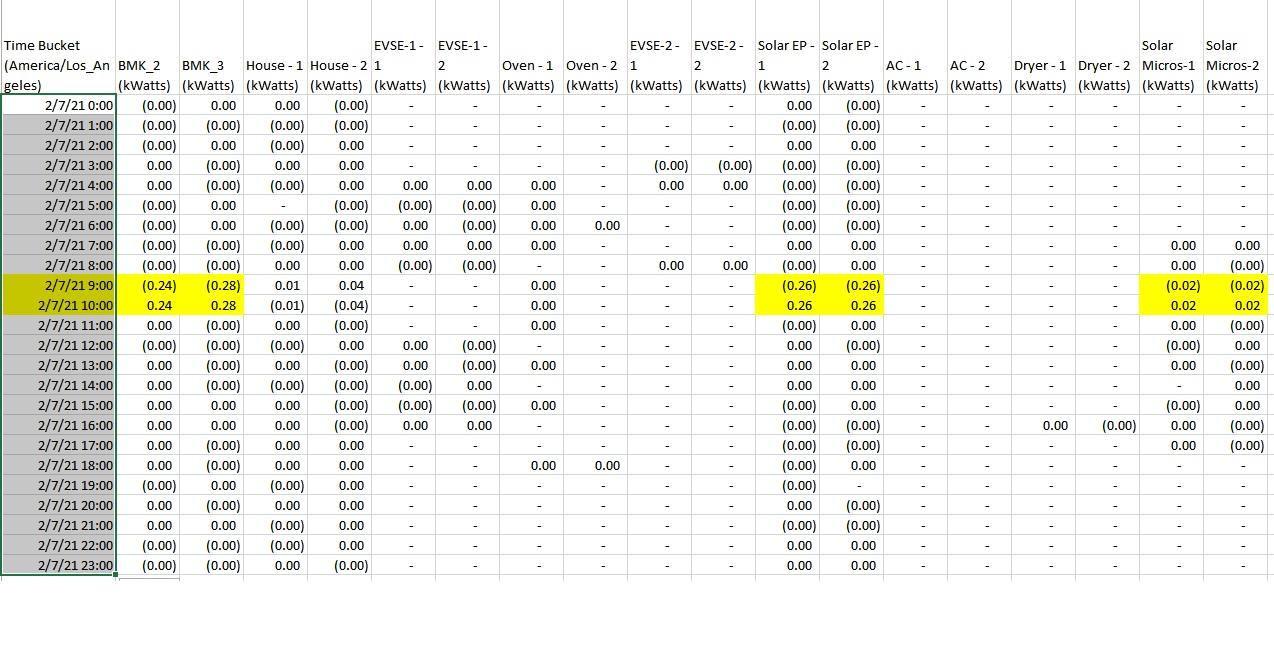
MemberTo detect all discrepancies between the hourly report and the minute report, I recalculated all the hourly data from the minute data in excel and made a difference table between the recalculated hourly data and the downloaded hourly data, and the error in the downloaded hourly data appear clearly, always over two consecutive numbers, with equal deviation up and down.
This is the same phenomenon that was initially detected and reported in this thread, between the seconds data and the minute data.
So I assume all starts with the seconds data that is correct, then when minutes data is calculated that error occurs occasionally, and then when the Hourly data is calculated, the same happens (I have not check daily data yet)

-
scrambler
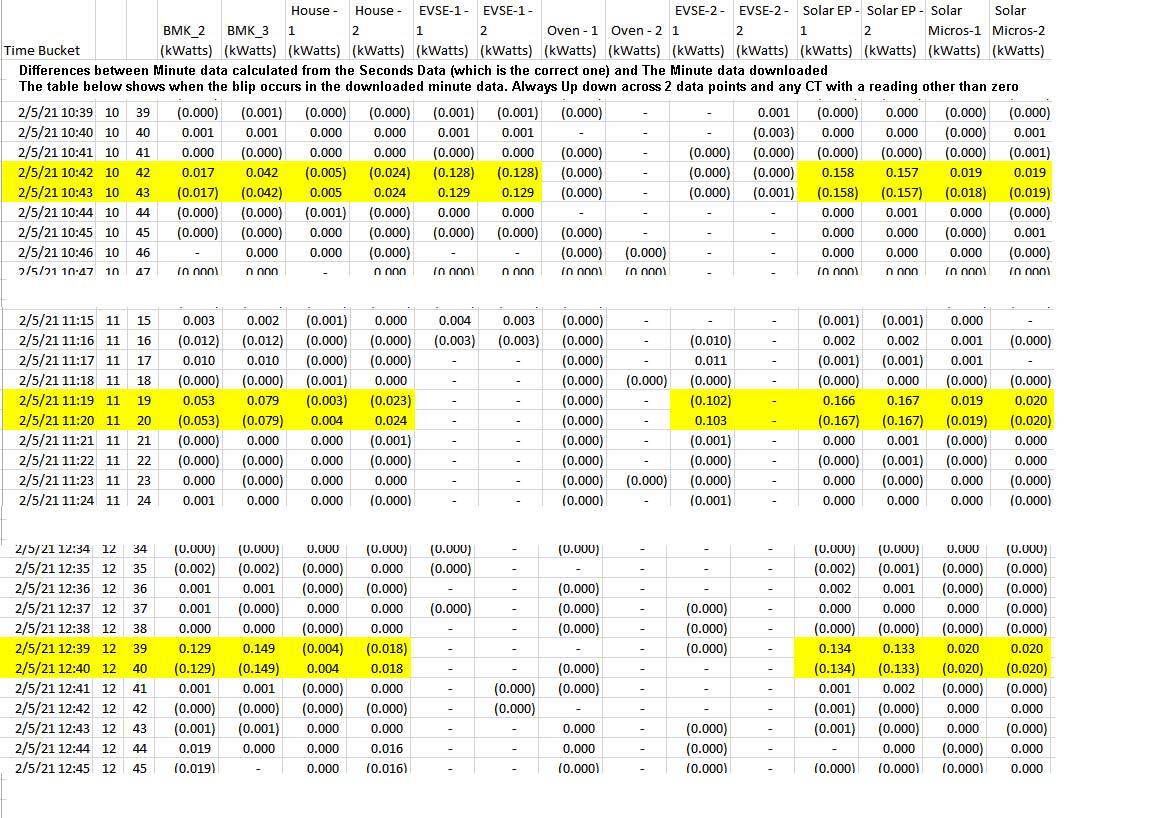
MemberI created the same difference table with the Feb 5th seconds data.
I calculated the minute data from the seconds data, and made the difference with the downloaded minute data. The blips illustrated in the first post appear across all CTs that have a non zero reading.

-
-
AuthorPosts
- You must be logged in to reply to this topic.
