Emporia Energy Community › Support Center › Emporia App › How long is data stored for?
- This topic has 8 replies, 4 voices, and was last updated 1 year, 8 months ago by
MattS.
-
AuthorPosts
-
-
rowan.bradley
MemberHow long does Emporia store my data for? How far back can I see or download per second data, per minute, per hour, per day? Ideally I need to be able to see a year’s data to understand how much energy I’m using and how much my solar panels are generating across the year. I’d like to be able to do this now, and not to have to wait for a year to do it, because I’m trying to evaluate whether a battery will be worth installing.
Thank you – Rowan
-
MattS
MemberIt appears to be multi-year capable, going by the year view.
Exporting raw data (via web app) from what I can tell is:
1 sec data for ~ 1 day
1 min data for ~ 1 week
15 min data for ~ 2 months
(I can’t tell more as the most raw data I can export is from the 1st of the prior month – April 1st in my case today).
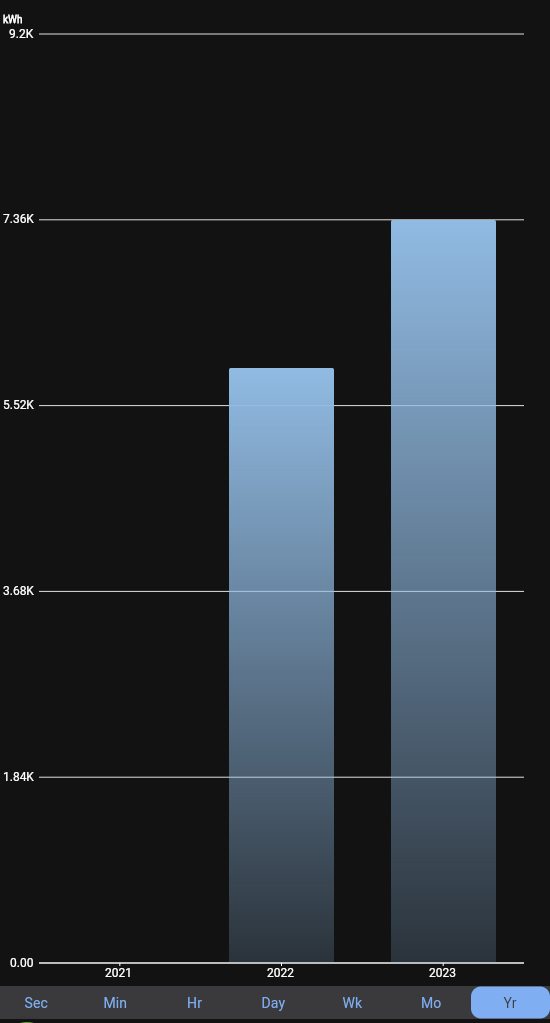
But based on the image below, it stores daily for at least 10 months (that’s when I installed my unit).

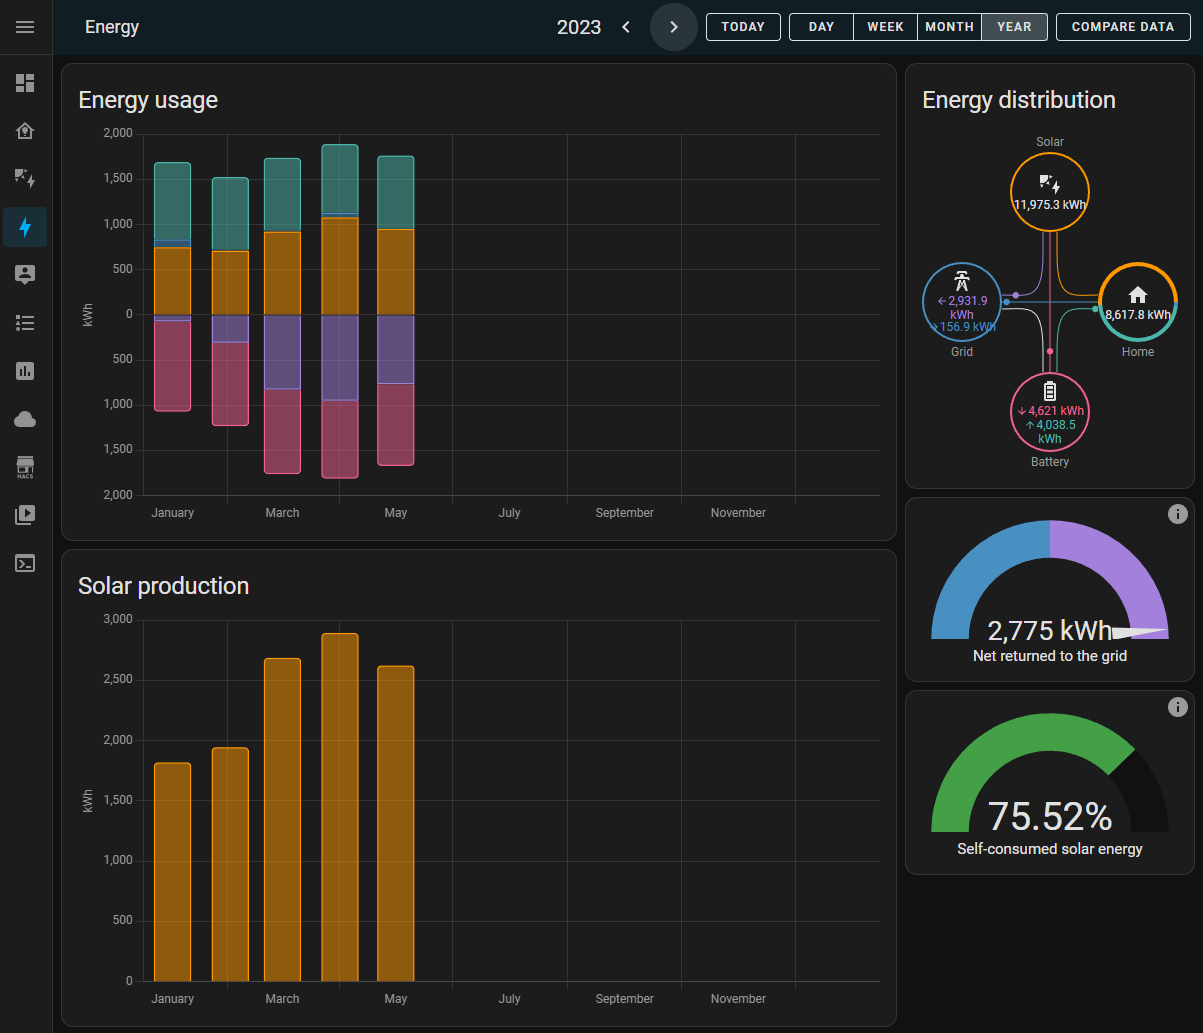
Something to note, I have my emporia integrated with Home Assistant (homeassistant.io), which is what I use to record historical data over time. It has a much better way of displaying and categorizing the recorded data from Emporia (and other sources). Attaching an example below.

-
-
MattS
MemberTo use Emporia on Home Assistant, you use the HACS plugin, then the Emporia module:
https://github.com/magico13/ha-emporia-vue
It is using the Emporia API to access. The link above gives more details.
HTH!
-
scrambler
MemberThanks
-
flyoffacliff
MemberHow did you get each CT on the energy graph in home assistant to show up a separate color like that? I spent hours trying to do that and everyone just said it wasn’t possible.
-
MattS
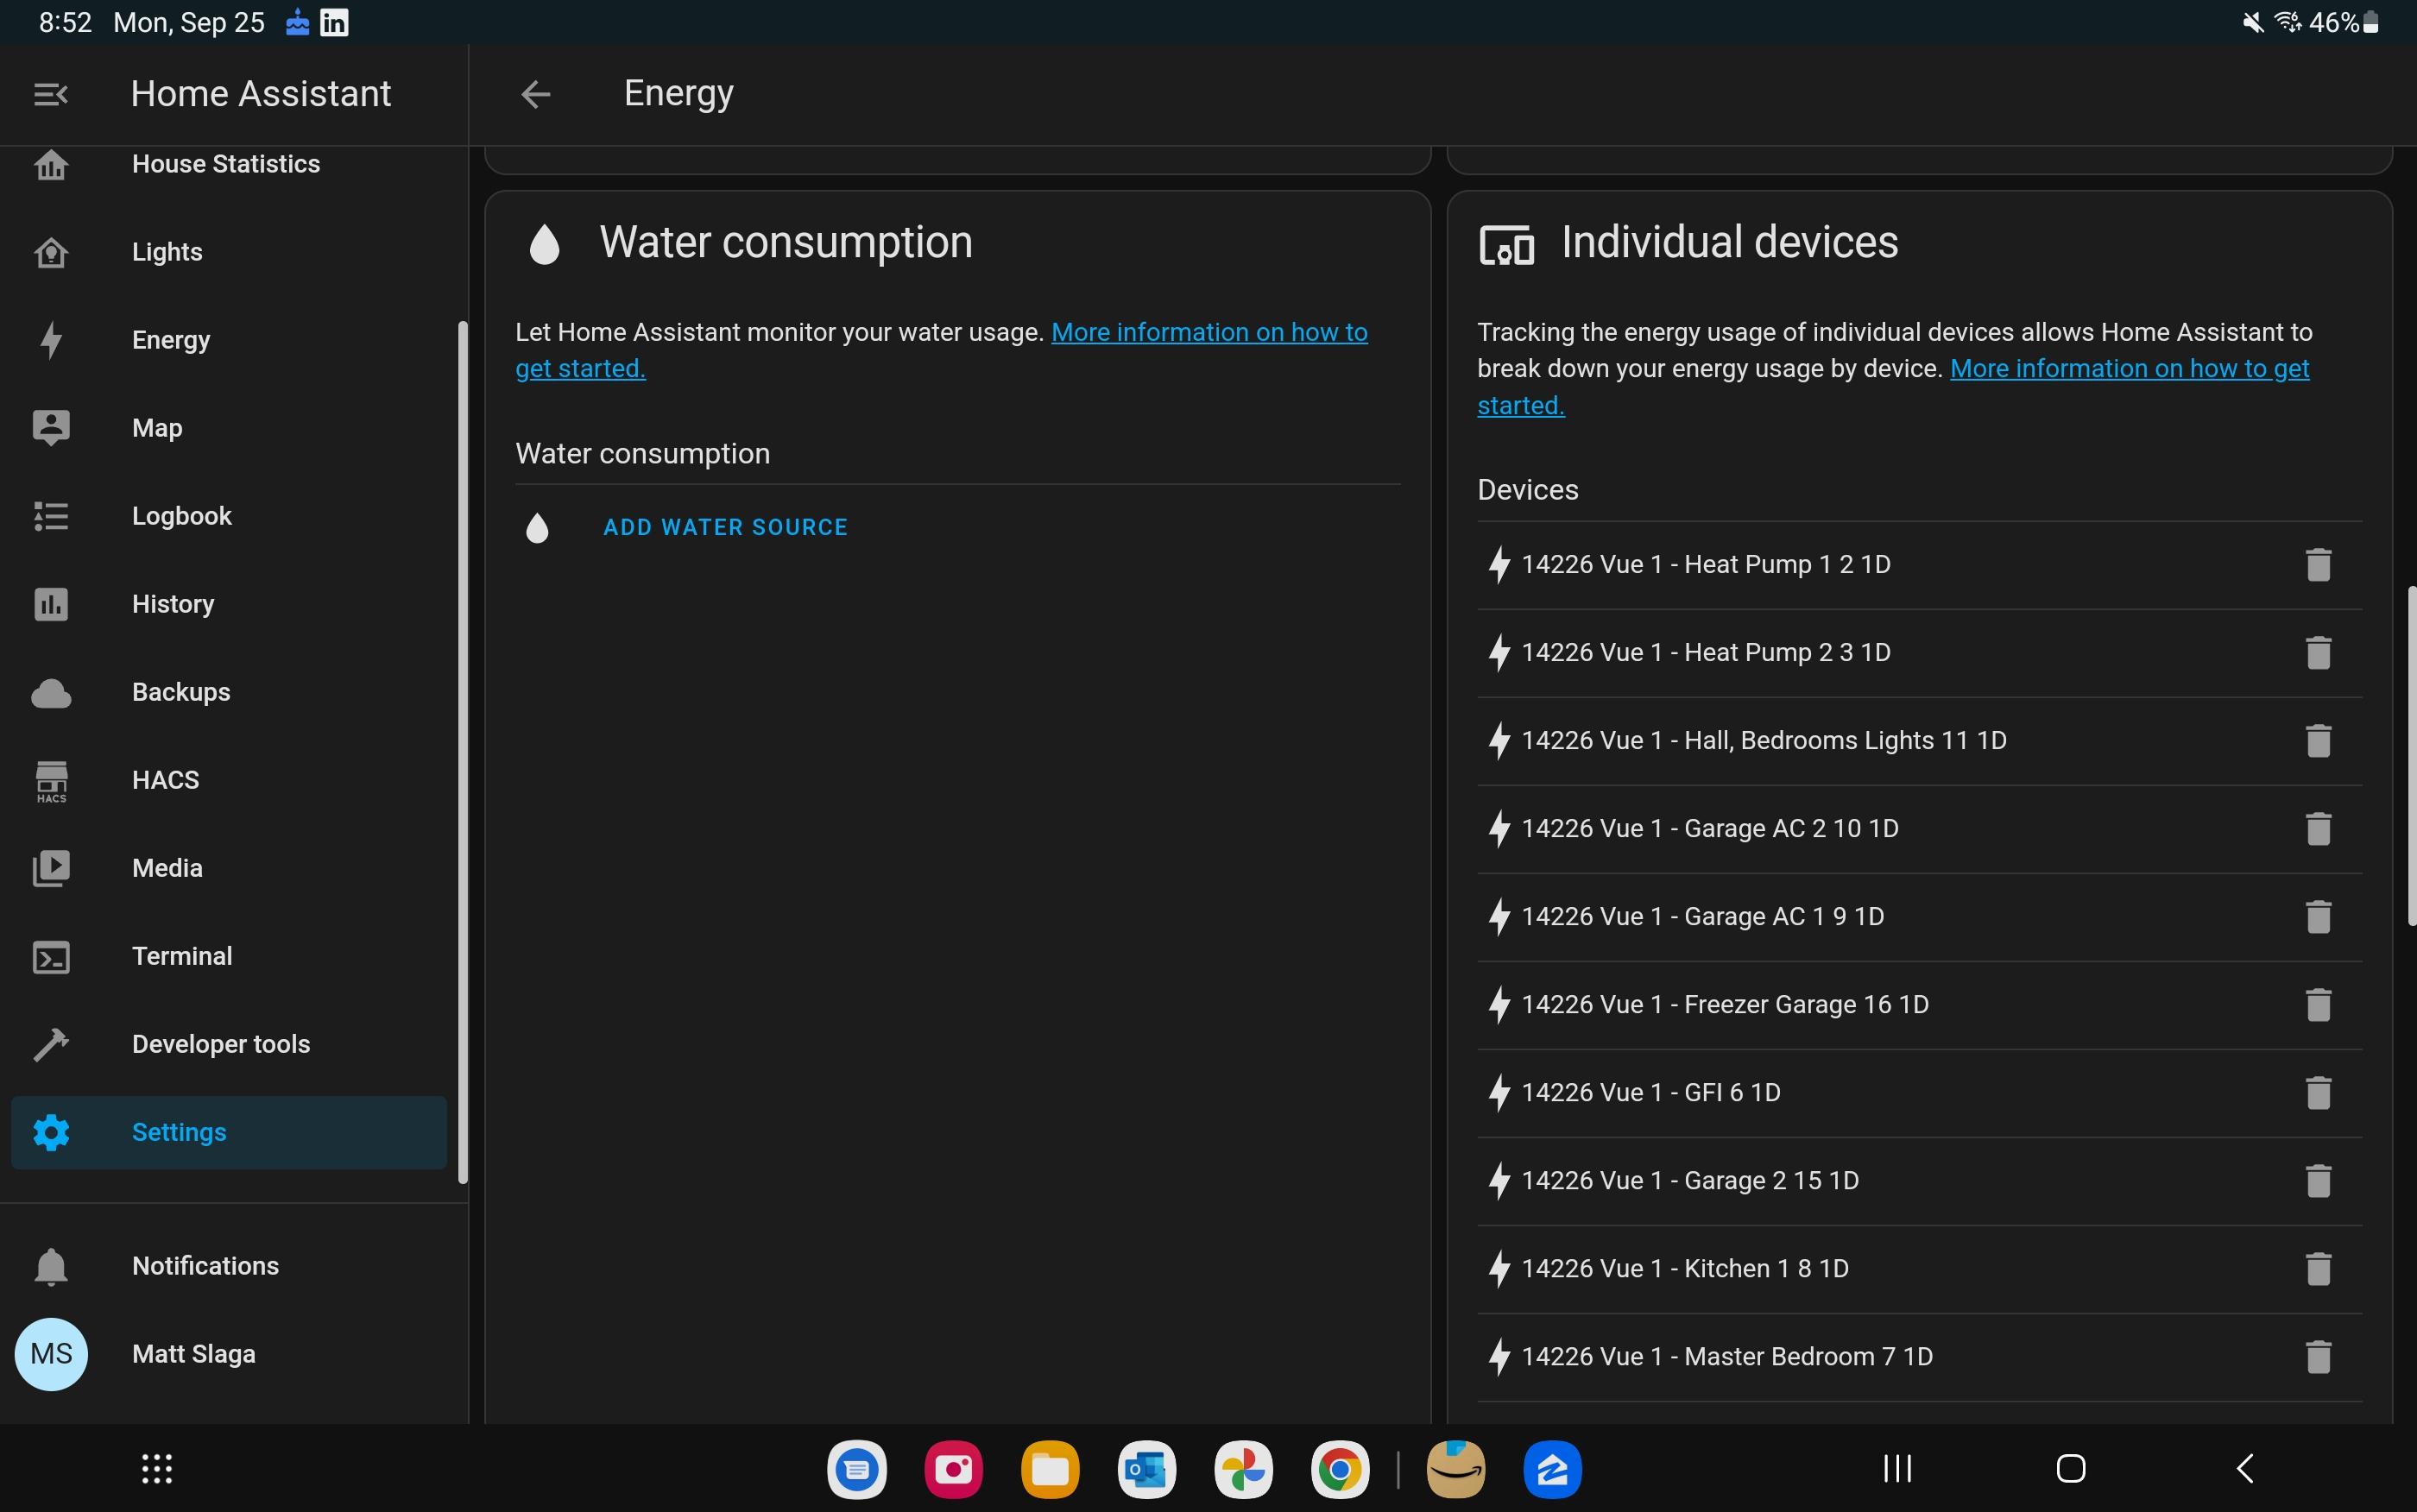
MemberIf you go to settings, dashboards, and edit the Energy dasboard, there is an option for individual devices. That’s where I added the individual monitored circuits. Hope this helps!

-
flyoffacliff
MemberYes it does, thanks. When I added them there, It did not make a nice graph like that. There must be another widget on there that you can add separately that’s not on the default energy dashboard.
-
MattS
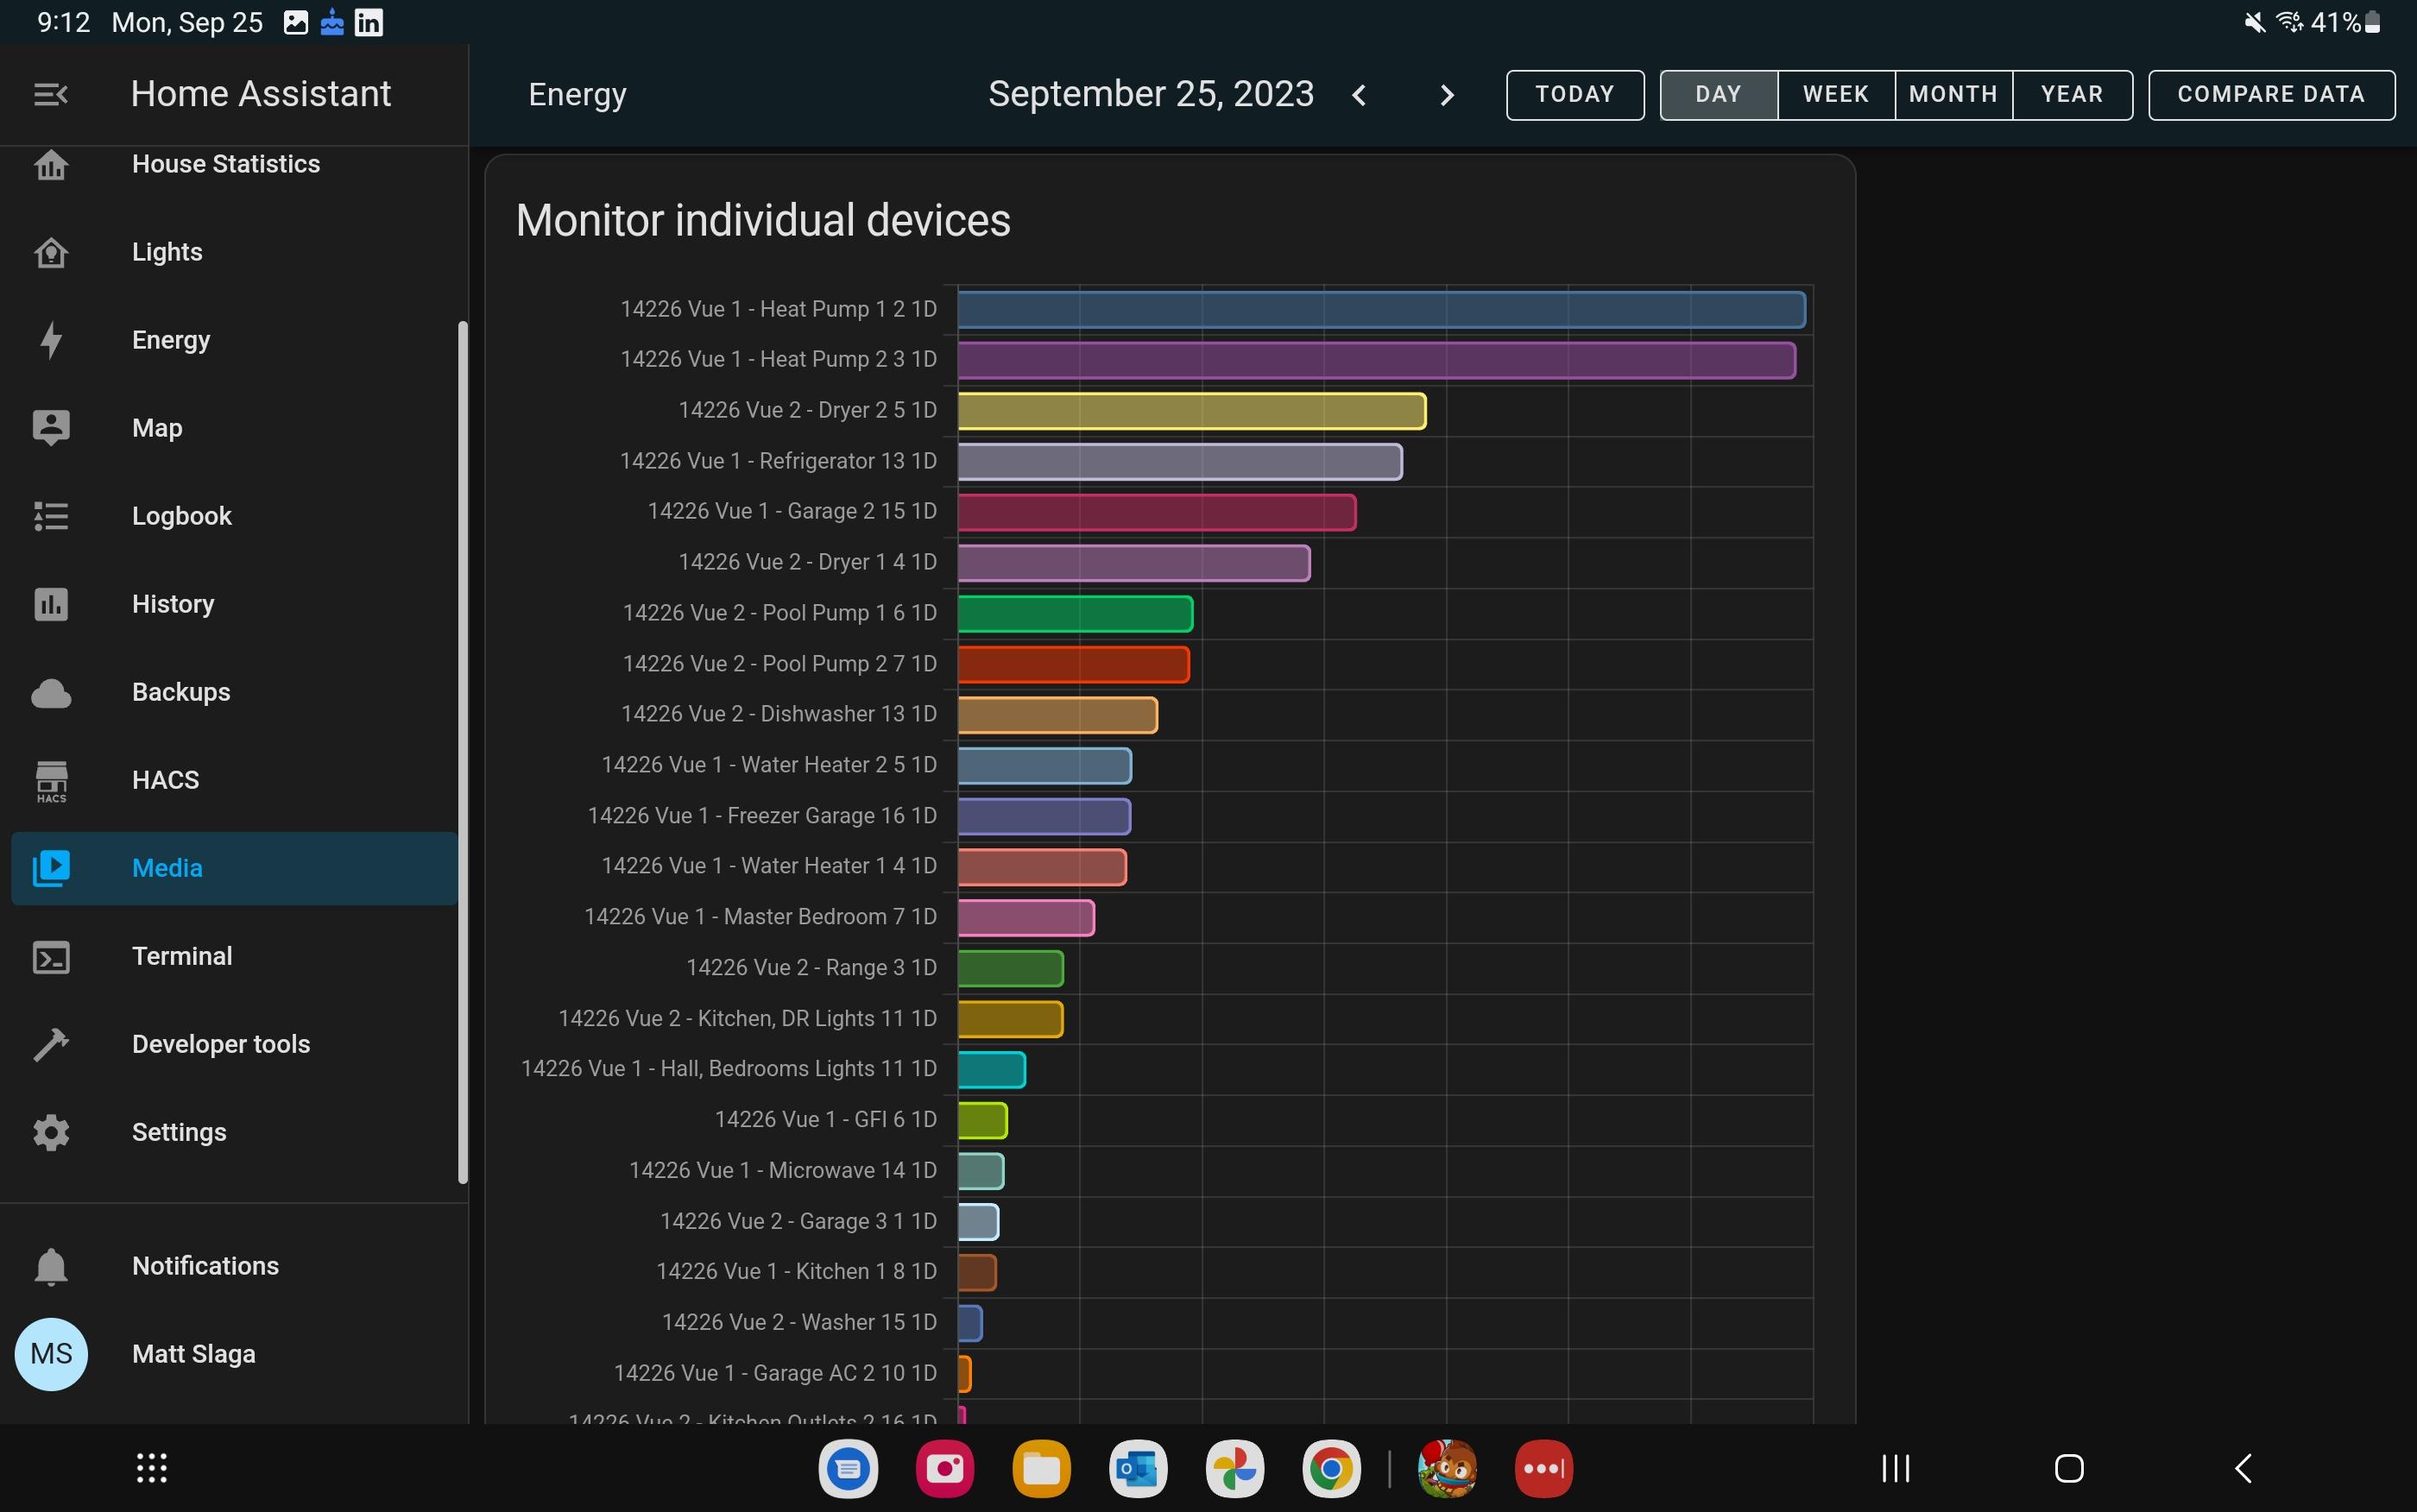
MemberIf you mean the graph at the top with the energy usage, that isn’t tied to my Emporia monitored circuits. That is just the representation of my energy directions. Solar to house, grid to house, solar to grid, solar to batteries, etc. My individual circuits show below those sections like this:

-
-
AuthorPosts
- You must be logged in to reply to this topic.
