Emporia Energy Community › Product Ideas › Virtual Panel and Circuit Tracking
- This topic has 3 replies, 2 voices, and was last updated 5 years, 1 month ago by
PhiDelt496.
-
AuthorPosts
-
-
PhiDelt496
MemberBeen using the app for about 4 months now and just had some thoughts to post about the experience.
I know it is kind of a whole new app almost, but what would be really slick is a “Virtual Panel” image to create a physical topology representation. Be able to label each circuit as its installed and check it as monitored or unmonitored and what port on the expansion module its connected to. Could even do a Real-Time display of the monitored circuits’ current draw. Essentially I list ALL of my house circuits to Emporia, but data is only sent for the 8 that I have monitored…all others show 0 usage. This would allow me to move a monitor from one circuit to another without the data getting all confusing. Take this one step farther and you would have a platform to allow multiple Vue’s w/expansion modules and no main circuit inputs to correctly monitor additional circuits in the same panel. And let you align sub panels more accurately with their physical installation.
It could start with something simple as just another representation of existing data, but eventually offer a lot more functionality.
Overall the App is really well done and the progress in just a few months is really impressive. Any other features I would like to see are either on the roadmap or being discussed on the forums. Really impressed with the support and service from Emporia so far…great operation.
-
douellet
MemberA “virtual panel” may be one way to show the installation, but a “virtual home” would be better to visualize the power usage. The interface would show you some home cross-section or a simplified floor plan with several icons representing the available appliances at their correct location in the home/apartment.
Implementation: to allow both types of representation (or whatever else), I suggest you import any background picture or drawing with whatever the user select, then overlay generic activity representation at user-selected positions on top of this picture. The background picture can be a picture of your electrical panel or anything else. All the work is on how to display proper text/graphics/animations at the right place on top of the user selected picture. Of course, this is more complex on a phone or tablet because of resolution change & screen rotation. It is also more complex if you have a single sensor monitoring multiple circuits or multiple appliances in the home.
Hope this helps some day for future development… Denis
-
douellet
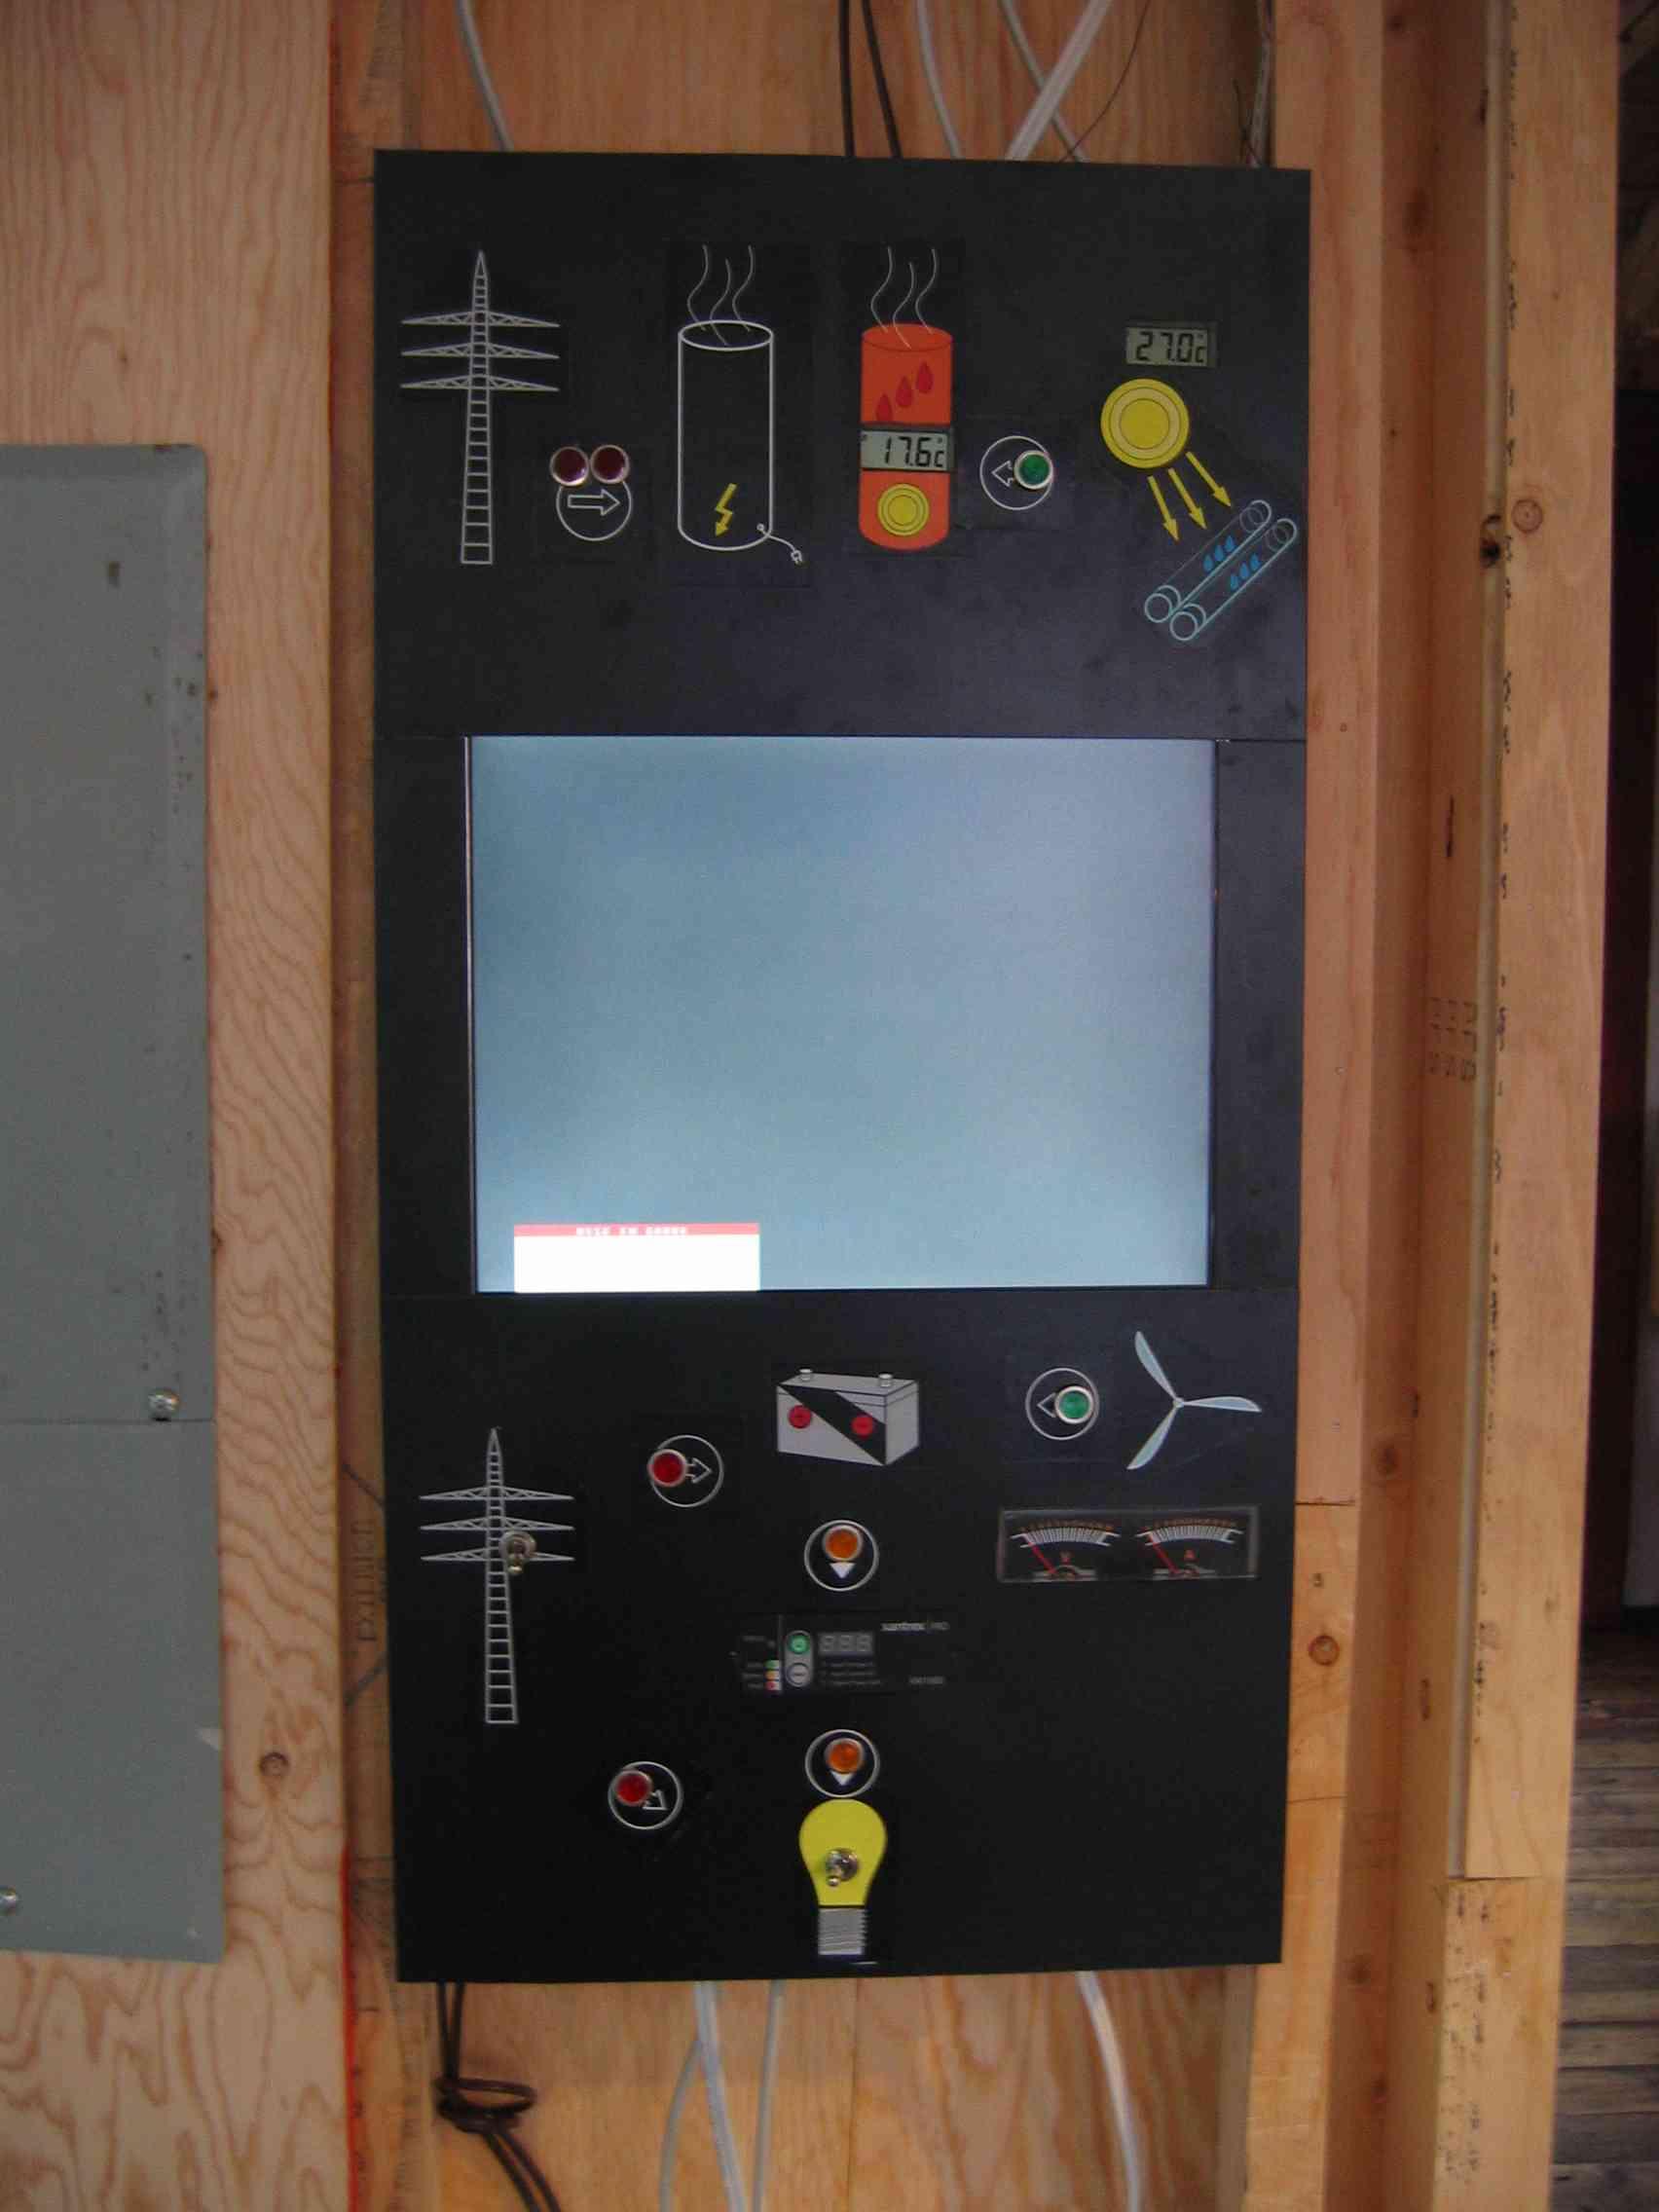
MemberHere is an example of a monitoring panel built in 2006 to control & monitor energy activity in a green home equipped with 3000W solar panels, solar water heater & a 400W windmill. The central portion of the board is a PC computer screen running a web browser to display data (web page with weather information & collected solar energy over time).

-
PhiDelt496
MemberThats an impressive monitor.
I dont quite expect a $3000 system for $99. I was just thinking that 99% of panels could be covered by 1-2 generic layouts. Just another way to represent the data thats already there. Could even be something electricians could offer on a job as a value add. Leave the homeowner with a map of their panel layout in the Emporia App?
The ability to reset usage on an individual channel would be great and is on the roadmap. But the ability to keep tracking for a large number of circuits would be nice.
Another thought that would be nice is a year over year weekly/monthly comparison. Essentially, did i use more this April vs. last?
-
-
AuthorPosts
- You must be logged in to reply to this topic.
