Emporia Energy Community › Product Ideas › Web-based app
- This topic has 29 replies, 24 voices, and was last updated 3 years, 7 months ago by
rpertusio.
-
AuthorPosts
-
-
jh26
MemberPlease add a web-based app in addition to the phone apps, so that we can see our data on a larger screen. Would be very nice to have usage alerts and daily summary emails too.
-
ecofriendlycheapass.com
MemberAgreed, would be easier to dig into the data on a bigger screen!
-
robnelsen
MemberYes Please!
-
Jim @Emporia
Emporia StaffThis is the number one request that we get, but also a big undertaking. It’s a priority for us and we’re getting to it as quickly as we can. Thanks as always for your suggestions!
-
trigordon
MemberInstall the Bluestacks android emulator program on your PC. Then download the Emporia app in Bluestacks. Works great. i have a bunch of android programs running inside of Bluestacks.
If they could have a popup with the info on energy used when your mouse pointer hovers over a energy used column or right or left click
-
gspeters1965
MemberI’ll add my vote. Would love some web visualizations on usage by the mains and the circuits.
-
sean_8395
MemberJust here to +1 this!!
-
Zordrack
MemberAdding my +1.
This would definitely make my life easier.
-
Bmedfly
MemberWhen you make the Web-based app requirements, I would ensure they will work with Smart Home monitors like Sharptools and Actiontiles. It would be nice to have the energy monitoring as part of the larger Smart Home Eco System. The formats they require are pretty standard and you may already be compatible, but it would be good to check just incase.
https://sharptools.io/
https://www.actiontiles.com/app_about_www -
farcouet
MemberHello,
Web app will also be a great feature. Specially to export CSV.
Thanks!
Fred
-
perrynmyers
MemberWould like to +1 this as well.
-
jswhitfi
MemberJust hooked up my Vue2 and want to +1 this request. I see this thread is a year old so…
-
thunderflash
Member+1 from here as well.
-
rougkrist
MemberDitto +1!!
-
PowEEr
MemberOr make a public API to access V/I on each sensor and we’ll make the app for you.
-
davidascher
MemberYou should be able to outsource the development of the API. An API is key to expanding beyond the capabilities of the vue app. You would see your devices connected to all kinds of much more flexible and more mature monitoring and control systems so you don’t have to re-invent all those wheels.
You would also get all the ‘one off’ “special requirements” folks off your back. Why would you want to drag your feet on developing an API unless you want to be a little guy tied to Google and Amazon?
-
ItsJohannaWren
MemberI’ve been working on a local data viewing system for about a week. Right now it pulls data into ElasticSearch for charting with Grafana. It can handle multiple accounts if people are interested in interacting with data in a more customizable way. The downside is that it does need your Emporia account email address and password– and I haven’t even touch setting up a secure system for that (though I’m think something web-based that instantly converts the info to tokens by talking with Amazon Cognito so raw credentials aren’t ever stored). Anyways, let me know if you’re interested.
@Emporia – I’m being nice to the servers… 15s gather interval, caching what I can for a while (devices and channels), and only grabbing the last minute of data with 1s resolution. If you’d like me to adjust this, I can. As I add more accounts to test with I’ll be spreading them over the 15s interval to avoid a thundering herd.-
This reply was modified 4 years, 4 months ago by
ItsJohannaWren. Reason: Adding notifications
-
This reply was modified 4 years, 4 months ago by
-
John Polasek
MemberSemi reply and expansion of earlier posts; Modification of the “Raw data csv download” feature to do time variant sums (ie 15 sec, 30 sec, 1 minute, 10 minute, 1 hour, etc sums would greatly reduce the size of the downloads, and providing an option to post them as JSON or XML would be a very simple (and standard) API that would provide a huge number of developers everything they need to take advantage of a huge database of real time graphing and logging Apps out there.
-
ItsJohannaWren
MemberSo this is the simple version of what I’ve been working on. The backend will support multiple accounts and multiple devices per account. Grafana allows you to build in alerts.
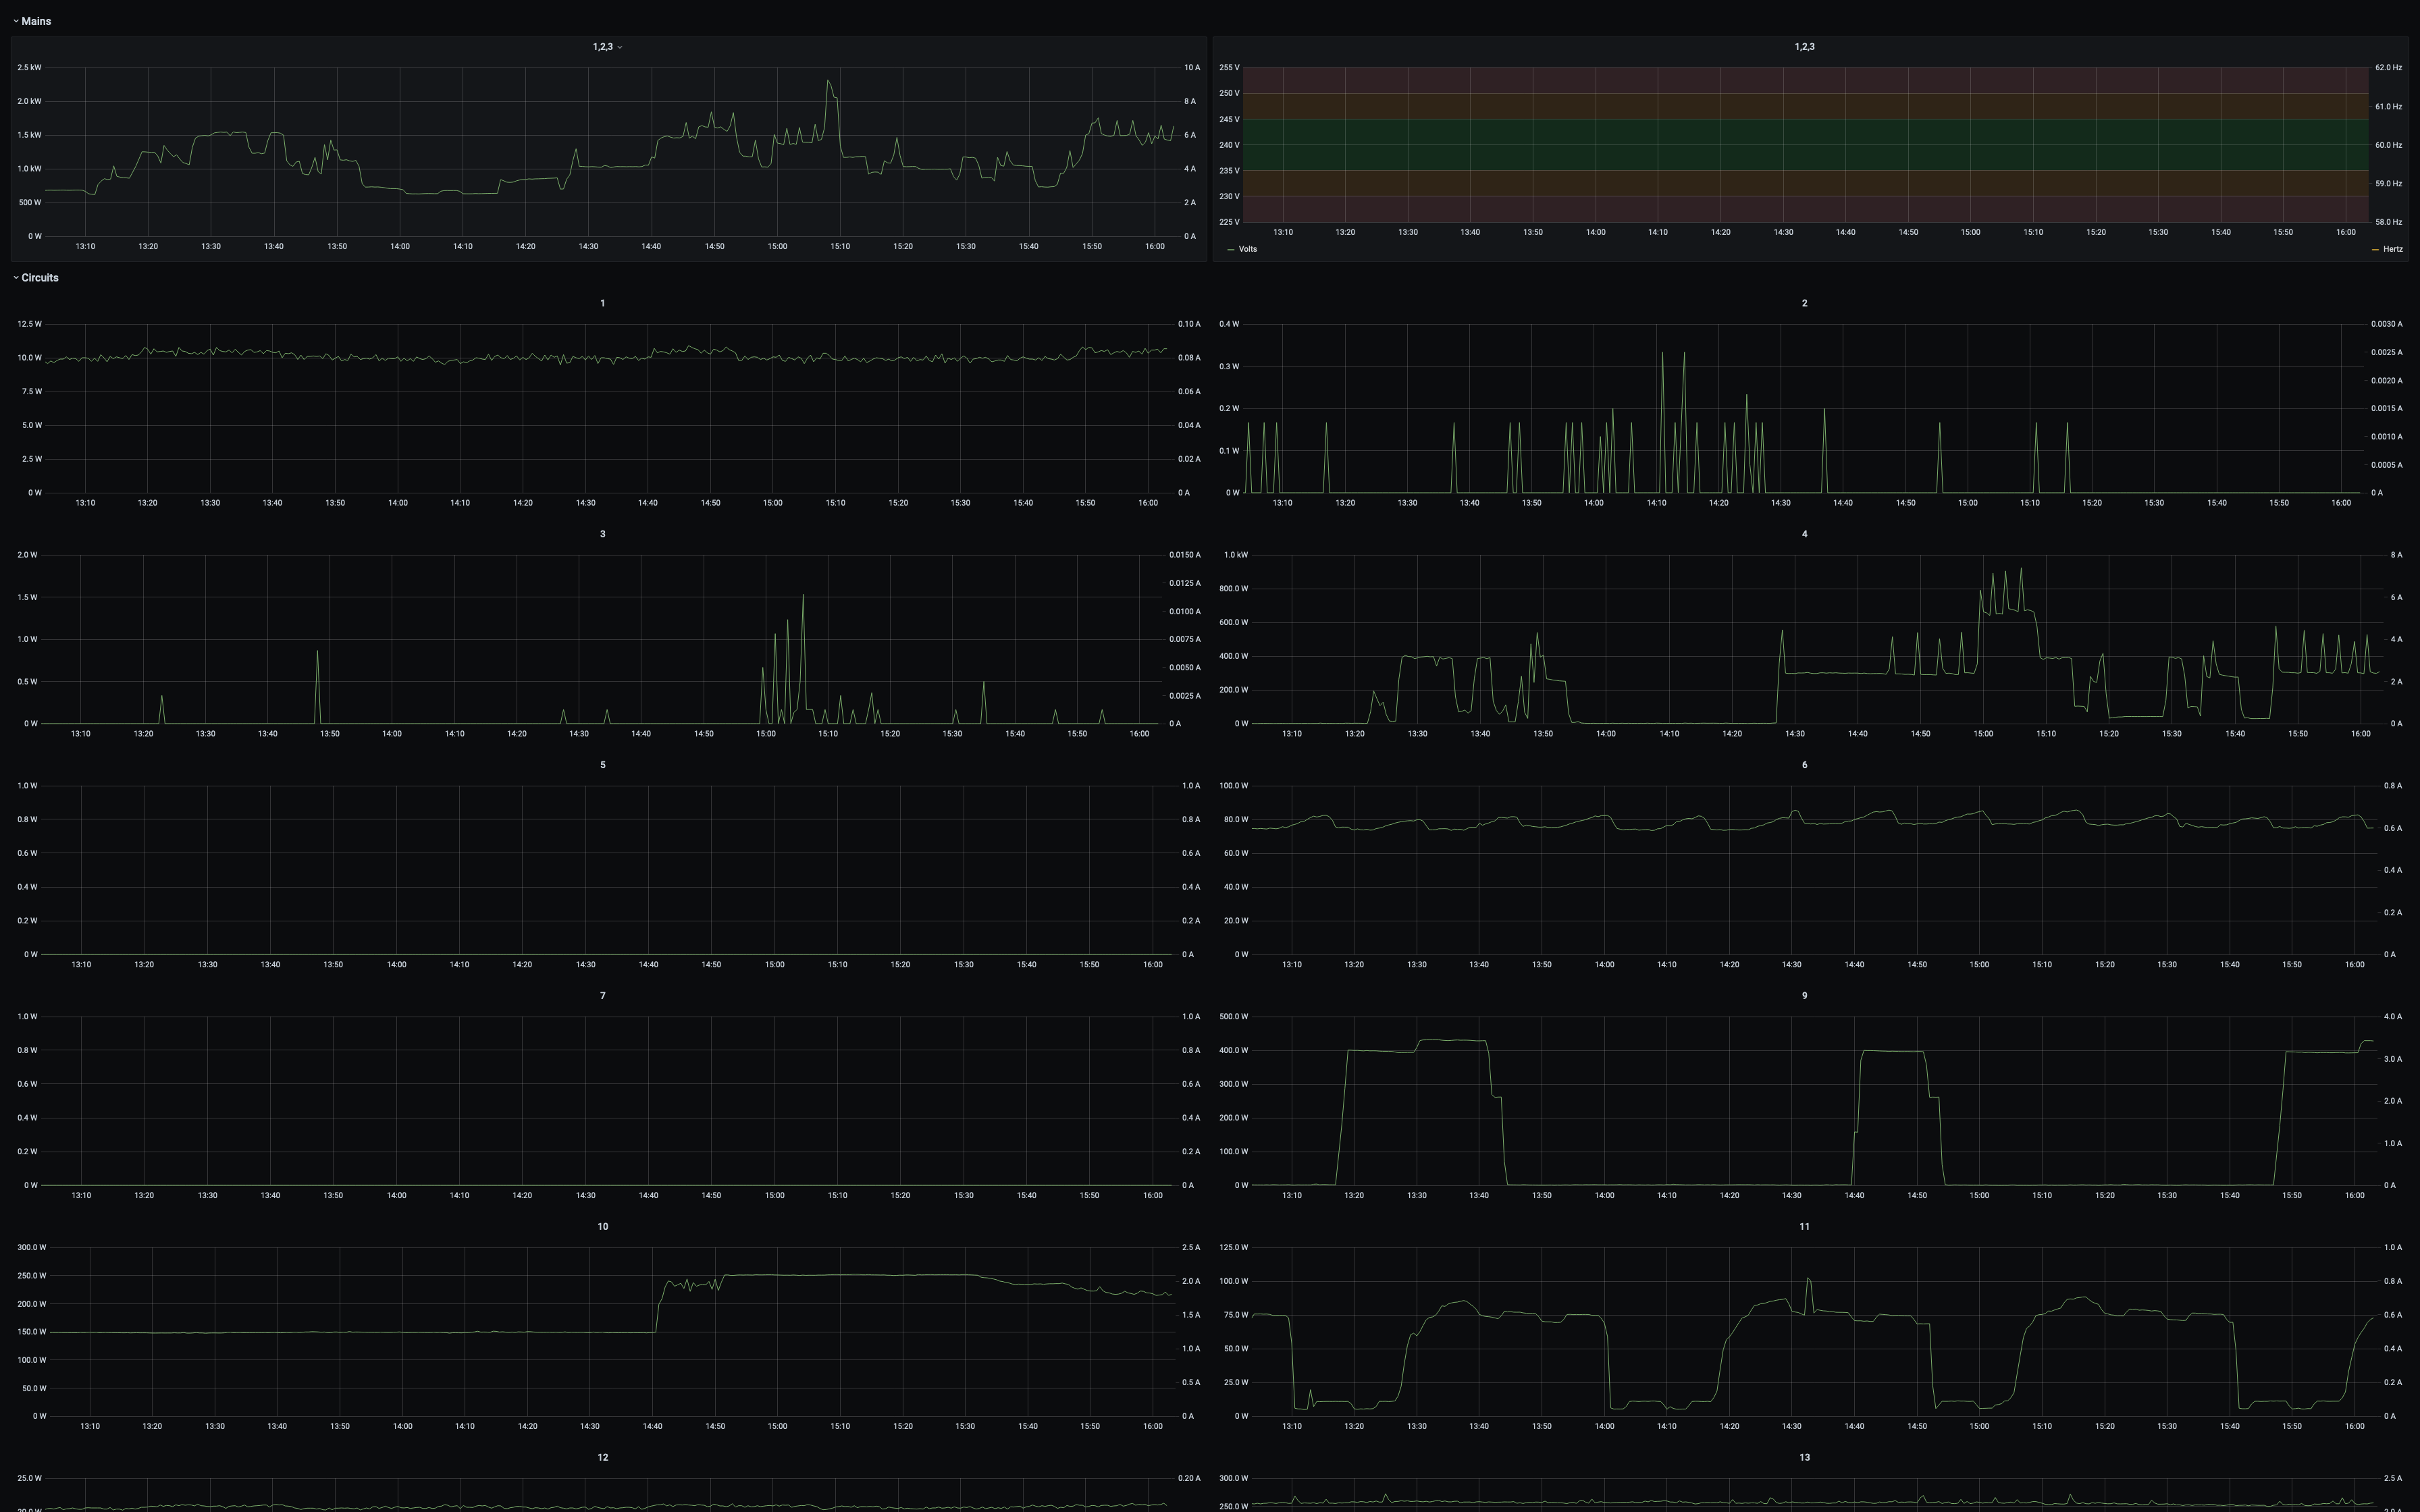 ElasticSearch -> Grafana using Python” />
 -
davidascher
Member“Right now it pulls data into ElasticSearch for charting with Grafana”
You list me at ElasticSearch. Actually, you skipped over how you get the data to play with in the first place. I cannot tell if you’re getting it locally (directly from the devices on the LAN or from Emporia’s cloud server or fROM some Amazon service that gets it from Emporia’s server. Can you back up and clarify?
-
ItsJohannaWren
MemberI’m using the PyEmVue module someone wrote to pull the data from Emporia’s system using the same API’s as the mobile applications. That script pulls data for the last 60 seconds every 15 seconds. Why the overlap? I’ve noticed zero watt entries or missing recent entries that are later filled in (makes me think they’re using an eventually-consistent database to store data or their pipeline is a little too long). Once my application has the data it puts it into ElasticSearch… ES is a form of database that is usually described as a document store, where you’re not required to have a set schema and documents don’t need to have the same fields, ie. the Tesla Wall Connector has hertz, volts, watthours, uptime, 3 temperature values, and fields for being connected and actually charging… but no other device does.
I’m thinking about getting another Vue Gen 2 to experiment with. Specifically, replacing the firmware to spit out data locally. I’m familiar with the Espressif microcontrollers that are used in the Vue products.
This chart covers two hours of samples for a Vue Connect and a Vue Gen 2. The drop-off near the end is me unplugging the Vue Connect to have a looksy inside. One document per sensor per second. Could I combine all of the sensors for a device into a single document? Yes. But that means I’d need more indexes to efficiently find data. More indexes generally mean more storage.

-
This reply was modified 4 years, 4 months ago by
ItsJohannaWren. Reason: Realized a long processing pipeline could also explain the missing recent entries
-
This reply was modified 4 years, 4 months ago by
-
waterboyz
MemberOh look what Jim@Emporia wrote on DECEMBER 1oth 2019.
“This is the number one request that we get, but also a big undertaking. It’s a priority for us and we’re getting to it as quickly as we can. Thanks as always for your suggestions!”
I want to +1 the desktop version. I’m old. Have poor vision. Have phat phingers that are a problem on my pocket computer.
Also, can we get a LIKE button on each of the comments in a thread and not just at the beginning?
-
rpertusio
MemberSimple, but not elegant solution (works for Windows or Mac)
1) Download and install “BlueStacks” from BlueStacks.com (it’s a big file, intended for running Android games on PC/Mac)
2) Launch the ‘Play Store’ in BlueStacks. (Use/Create Google account to log in)
3) Install “Emporia Energy” from Play Store
4) Open the newly installed Emporia Energy app
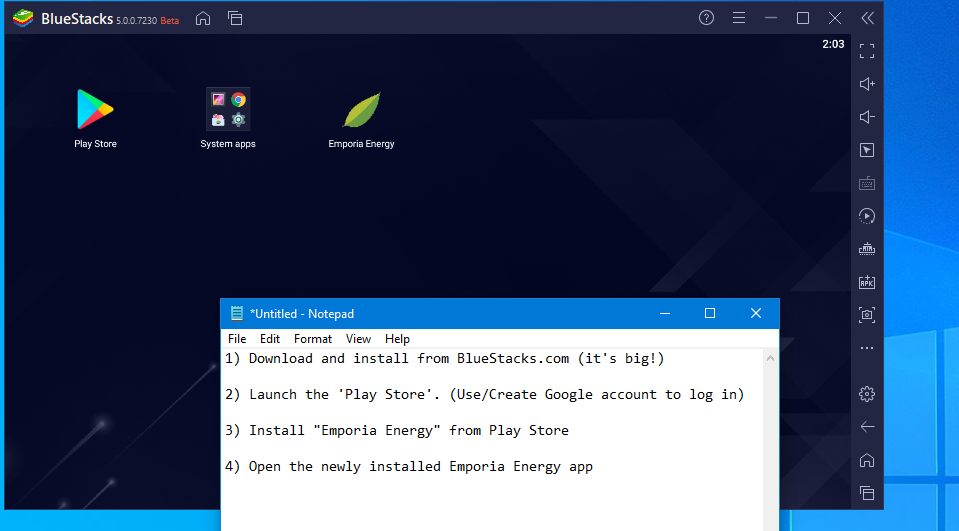
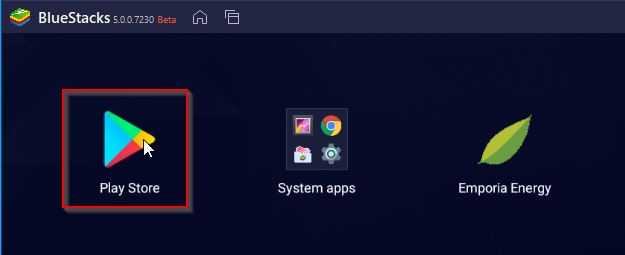
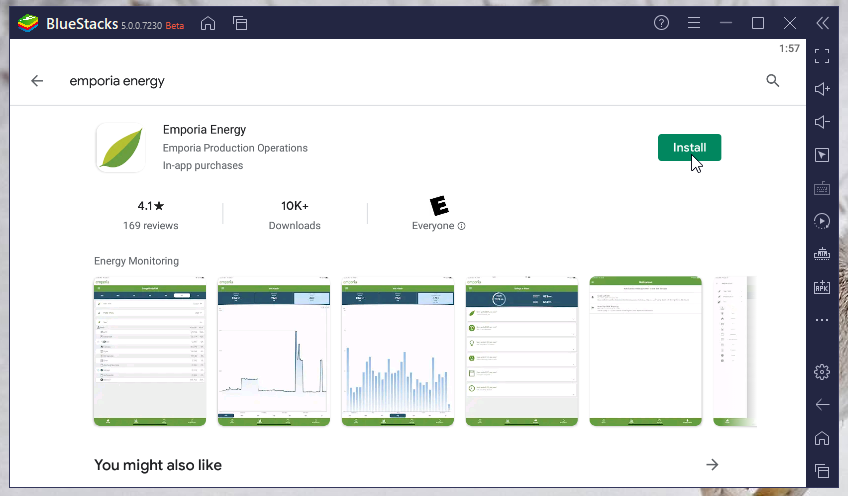
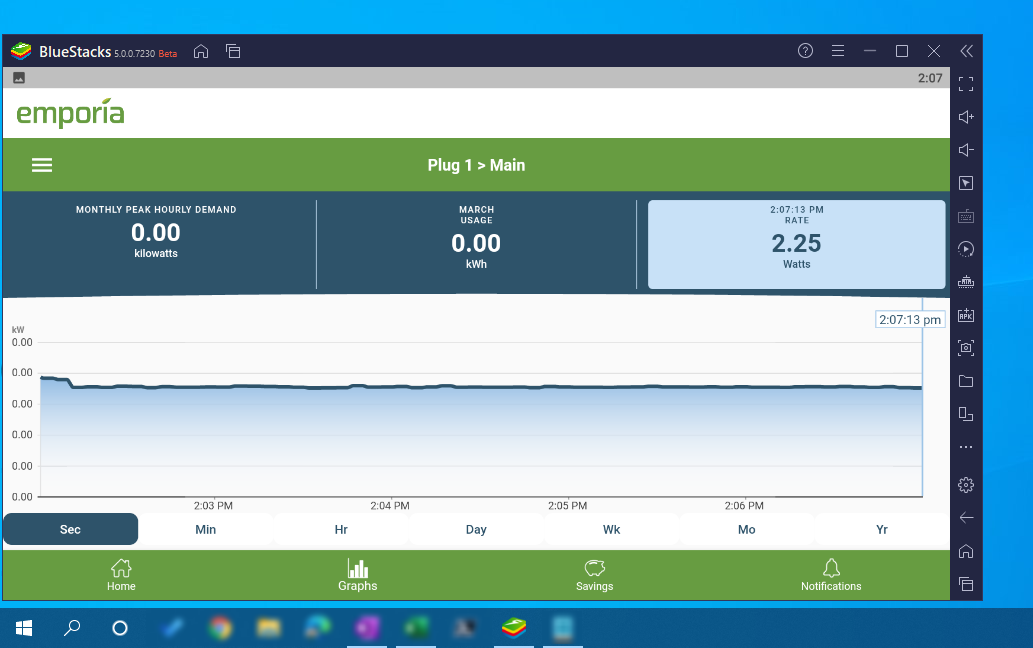
Hope this helps! (BlueStacks is helpful to run any Android app on a Mac/PC)
-Ryan
-
This reply was modified 4 years, 2 months ago by
rpertusio. Reason: Clickable link
-
This reply was modified 4 years, 2 months ago by
-
waterboyz
MemberI also installed BlueStacks just for this purpose. It works just fine.
-
twDragon
MemberI also like to have a web based view into my Emporia Vue 2 Monitor, And please add the option to get data for each phase on the power and volt at list and to point a location on the graph and get more data then just the time (it’s not acurate just to guess what was the power from the graph and it was nice to get the number displayed)
-
cdb95014
MemberMany thanks to rpertusio for the BlueStacks suggestion! Emporia should promote this, at least as an interim step before releasing their own web-based interface.
BlueStacks/Emporia works great, and with a modern GPU/CPU offers excellent performance. Downloading CSV files is also trivially easy.
Though it is amusing to launch a gaming platform to check energy consumption. 😀
We would not have purchased the Vue Home Utility Monitor without a desktop interface. Browsing detailed data on a mobile device is… sub-optimal. 😏
But our experience with the utility monitor has been so positive that we’ll be installing a 3x Vue system (main + two sub-panels) shortly if the ‘nesting’ works as advertised.
-
aiannone
MemberNew Emporia Vue2 user here. Love the kit, like the mobile app, hate that there isn’t a web based interface. Add this as a +1 for wanting a web based alternative to the mobile app.
-
bugalou
MemberI was working on integrating the Vue app into Appetize.io which is like bluestacks but runs through a browser. I was having some trouble though and need closer access to the dev project files. If I could get someone to work with I could integrate it, or if they do not want to share maybe someone internally can do it. Or throw me a few bucks and an I’ll sign an NDA and integrate it. In any case I really want this data on a desktop machine in some capacity and it must be through a web browser for universal access.
-
rpertusio
MemberIf you didn’t know, Windows 11 (a free upgrade from Win10 coming this winter) will include Android apps natively. (No BlueStacks required.)
Emporia needs to list their app in Amazon’s store to qualify. (That’s something Emporia could start working on now.)
-
rpertusio
MemberThanks Emporia for the (BETA) Web-based app!
https://web.emporiaenergy.com/
It seems logged in with the ‘Demo’ account by default. You can log out & log in with your account. (Menu -> Account -> Logout -> Login)
(Sidenote: Go Flutter!)
-
-
AuthorPosts
- You must be logged in to reply to this topic.
