Forum Replies Created
-
AuthorPosts
-
March 8, 2021 at 1:27 am in reply to: Amp text display seems truncated down instead of being rounded #7115 Report Abuse
douellet
MemberNo more decimals shown on values above or equal to 10 Amps (going grom 9.99A to 10A, not 10.0A). We loose 1 good significant digit and the second digit is still wrong in the case of 15A displayed for a load of 15.7A.
March 6, 2021 at 5:30 pm in reply to: Emporia limiting minute data to 3 day starting march 1st #7101 Report AbuseMemberThat’s a shame. I expected an improvement of the interface and better ways to view and compare the data accumulated over time. With this drastic policy change, it seems you just throw all the valuable data down the drain and you won’t ever be able to improve the user experience.
My recommendation would be that you at least let the client-side application (or agent software on PC) synchronize all data to local storage on the cloud (Google Drive, One Drive or even on my PC harddrive), before it gets lost. And if the phone application can still read and show the local content, it would even be better.
MemberIt should work, because all your loads seem to be at 240V. There is no Neutral in your box for partial current return. The current will be the same on both Lines.
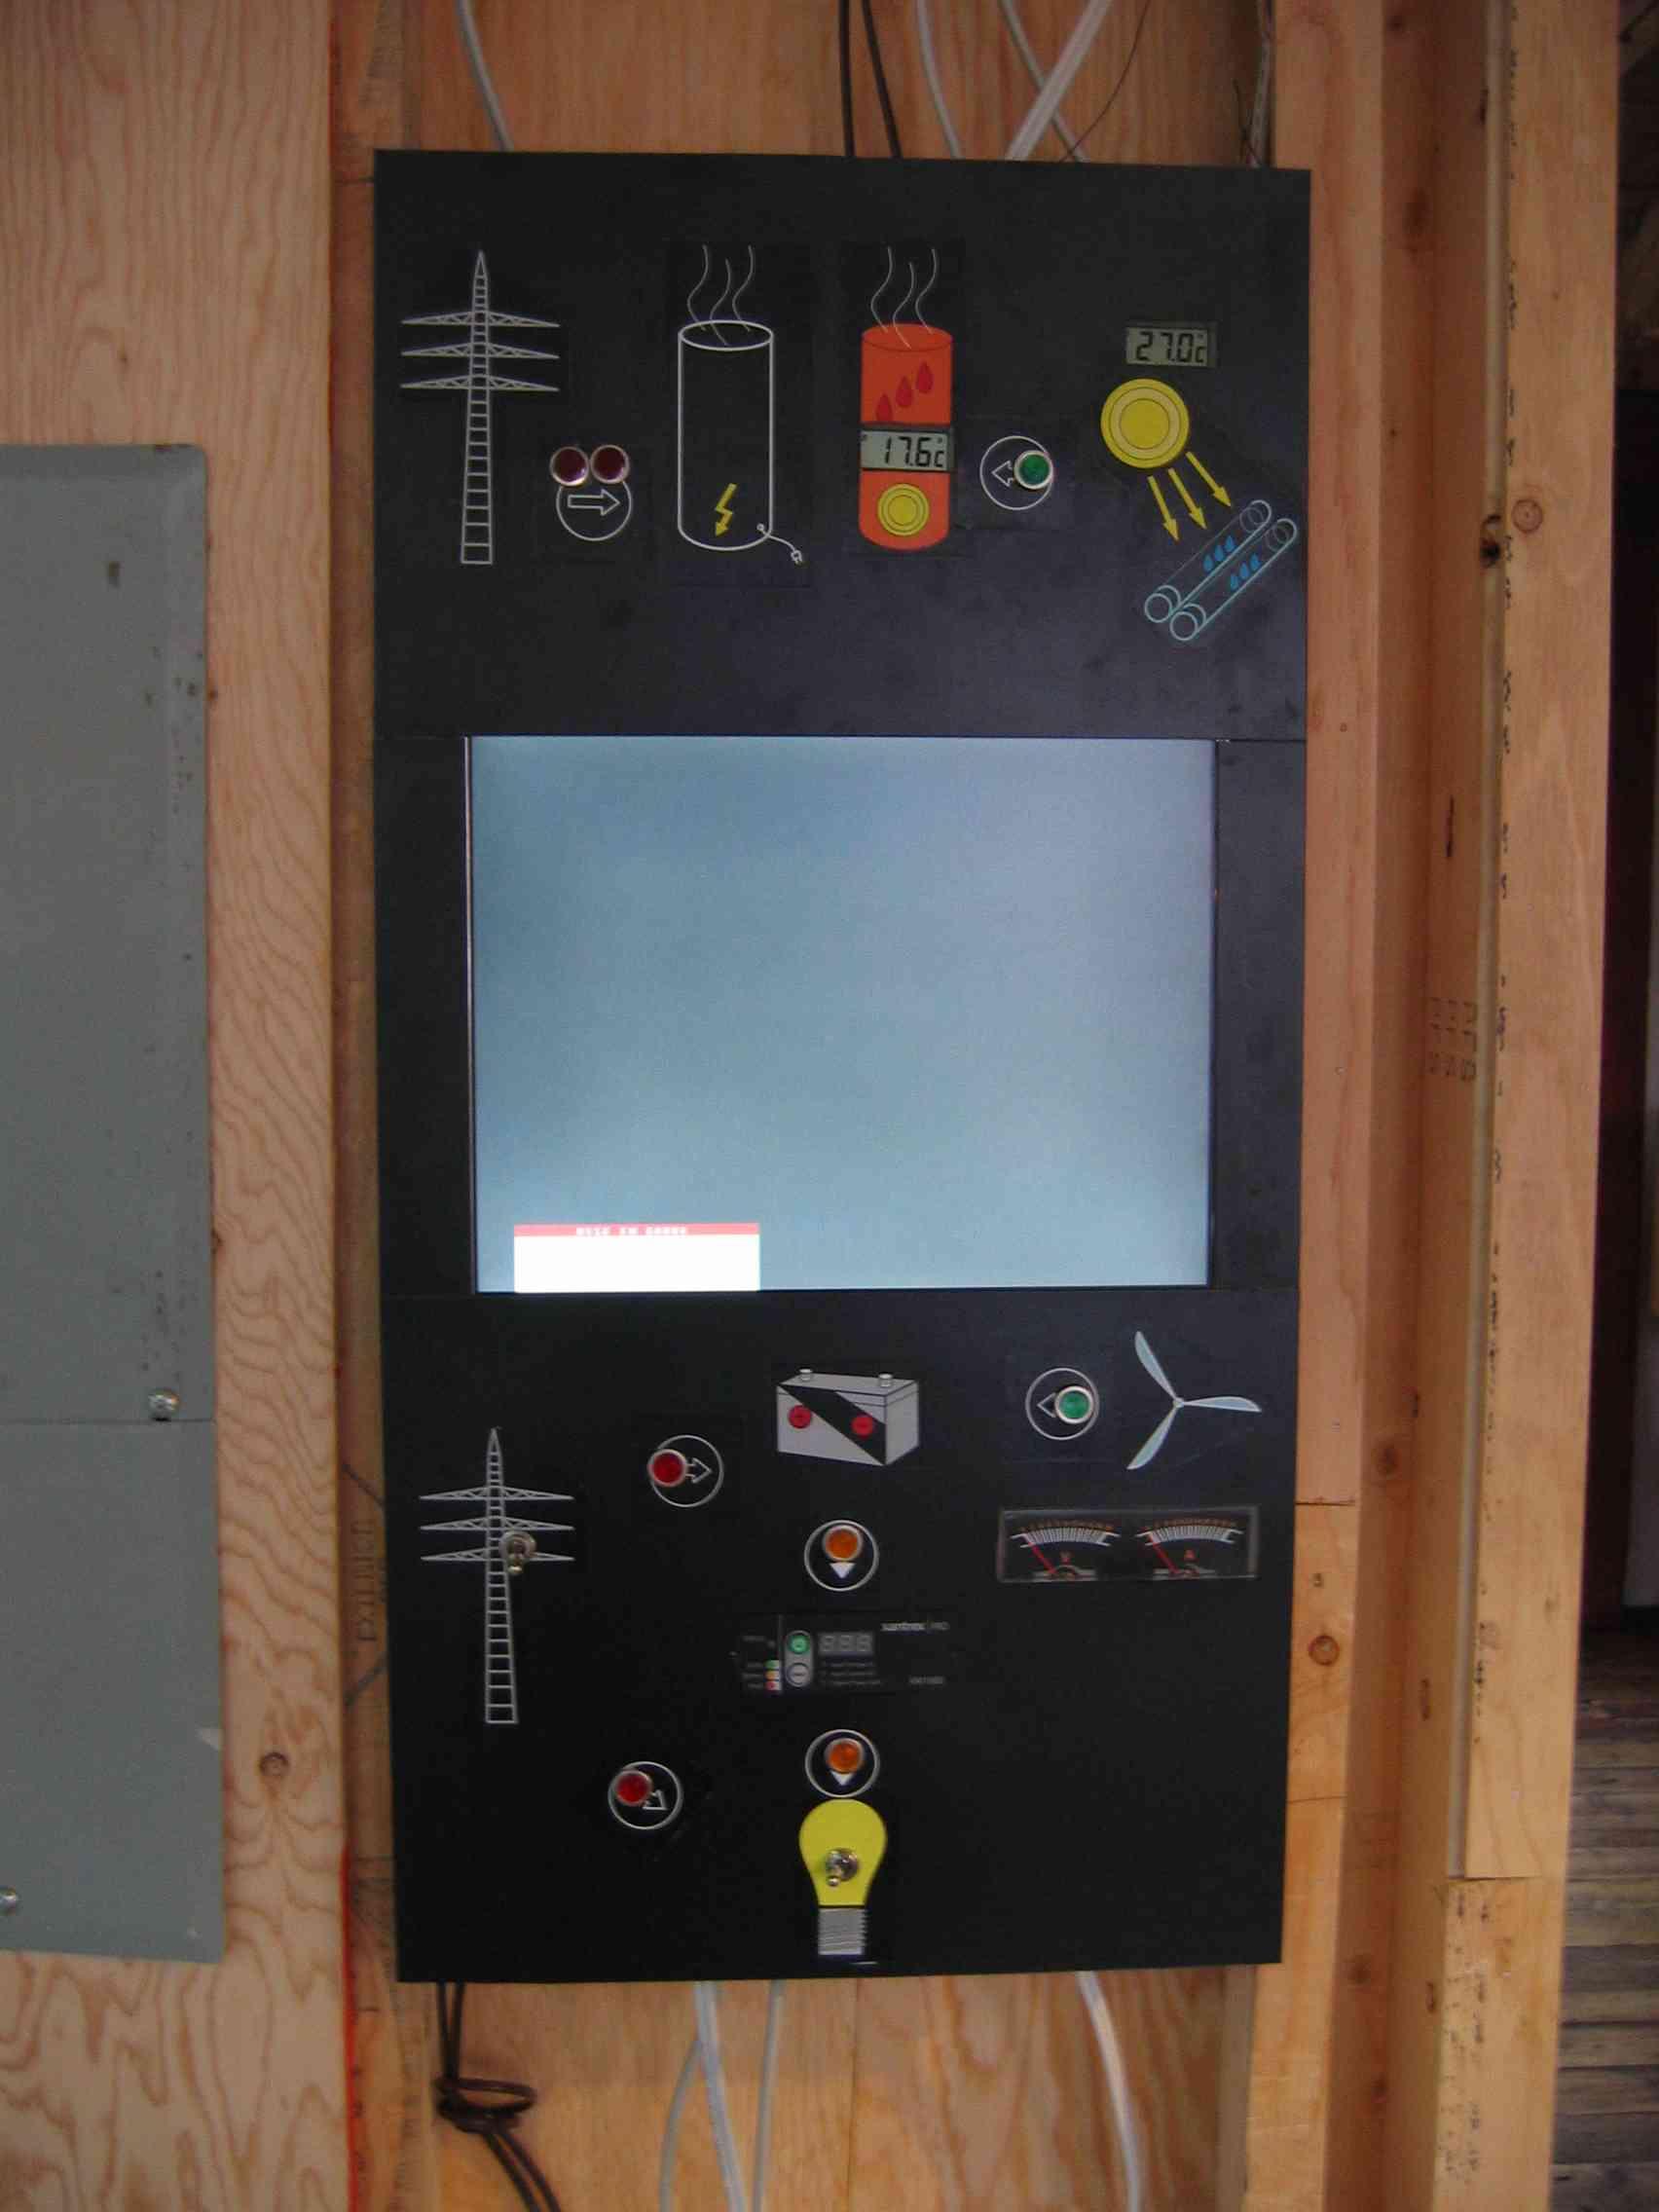
MemberHere is an example of a monitoring panel built in 2006 to control & monitor energy activity in a green home equipped with 3000W solar panels, solar water heater & a 400W windmill. The central portion of the board is a PC computer screen running a web browser to display data (web page with weather information & collected solar energy over time).
 Member
A “virtual panel” may be one way to show the installation, but a “virtual home” would be better to visualize the power usage. The interface would show you some home cross-section or a simplified floor plan with several icons representing the available appliances at their correct location in the home/apartment.
Implementation: to allow both types of representation (or whatever else), I suggest you import any background picture or drawing with whatever the user select, then overlay generic activity representation at user-selected positions on top of this picture. The background picture can be a picture of your electrical panel or anything else. All the work is on how to display proper text/graphics/animations at the right place on top of the user selected picture. Of course, this is more complex on a phone or tablet because of resolution change & screen rotation. It is also more complex if you have a single sensor monitoring multiple circuits or multiple appliances in the home.
Hope this helps some day for future development… Denis
April 11, 2020 at 7:51 pm in reply to: Amp values shown are doubled for 240V circuits #6129 Report AbuseMemberI’ve found a related post for this problem in the bug report section. (It will eventually be fixed by applying the x2 multiplier on Voltage instead of Amps.)
Denis
MemberI have the same problems here (reported the double Amp problem somewhere else in the forums) and I also observed the negative values on the Other (the dryer reaches nearly twice the power measured on the mains.
Thanks, Denis
April 10, 2020 at 9:04 pm in reply to: Ability to customize when my monthly usage starts accumulating. #6127 Report AbuseMemberMy utility company provides the following data which would be nice to input somewhere in the app to compare real data with the measurements…
Start date, End date (58 to 65 day periods to complicate things), kWh/period, avg kWh/day, avg outdoor temp/period, total cost $$$ (incl tax)
They also provide total values for the last 6 bills (last 12 months): total days (e.g. 369 days), kWh/last 12 months, Cost/12 months
So far, I compute the effective utility cost by dividing the overall cost. It changes every month, because there is a fix service rate (0.4593$/day) for the service, in addition to the usage kWh cost.
I believe it may be hard or complex to fully synchronize all the utility bill, but I believe the average data (kWh/d, avg temp and avg cost) would be a great addition.
MemberIt also works for with 2 different phases. You simply need to reverse the wire direction through the sensor for the opposite phase.
-
AuthorPosts