Forum Replies Created
-
AuthorPosts
-
May 17, 2021 at 6:05 pm in reply to: Visualizing Usage – Graphs help explain impacts of loads and overall usage #7481 Report Abuse
johnsko
MemberI am happy to share the Excel workbook I used to create the graphs. It is large because it contains all the data and charts. This is a public link so you should not need an account or anything else to access https://1drv.ms/x/s!As47IUP__v_UoOJqJCHwnov74b-GIg?e=bf64AA. The link will most likely open the browser-based version of Excel. The file is view-only so if you wish to edit, you will need to make your own copy. I suspect it will work better to open in the desktop Excel application.
My intent is to show that with some analysis there are valuable insights in the data and that Emporia could offer a service to automate and deliver such reports. I do not think many people will want to spend the time to collect, manipulate, and analyze the data themselves.
In case it helps, I will explain a bit more what I did:
- download and import into Excel CSVs from Emporia
- label and combine individual circuit data into more meaningful groups (4 groups comprise “base” and 4 more for “peak”)
- use various charting methods and data analysis formulas to summarize and display
The key insight Emporia could deliver–peak vs. base categorization and usage thereof–is an attribute of the usage itself and could be identified algorithmically (and so does not require customer input).
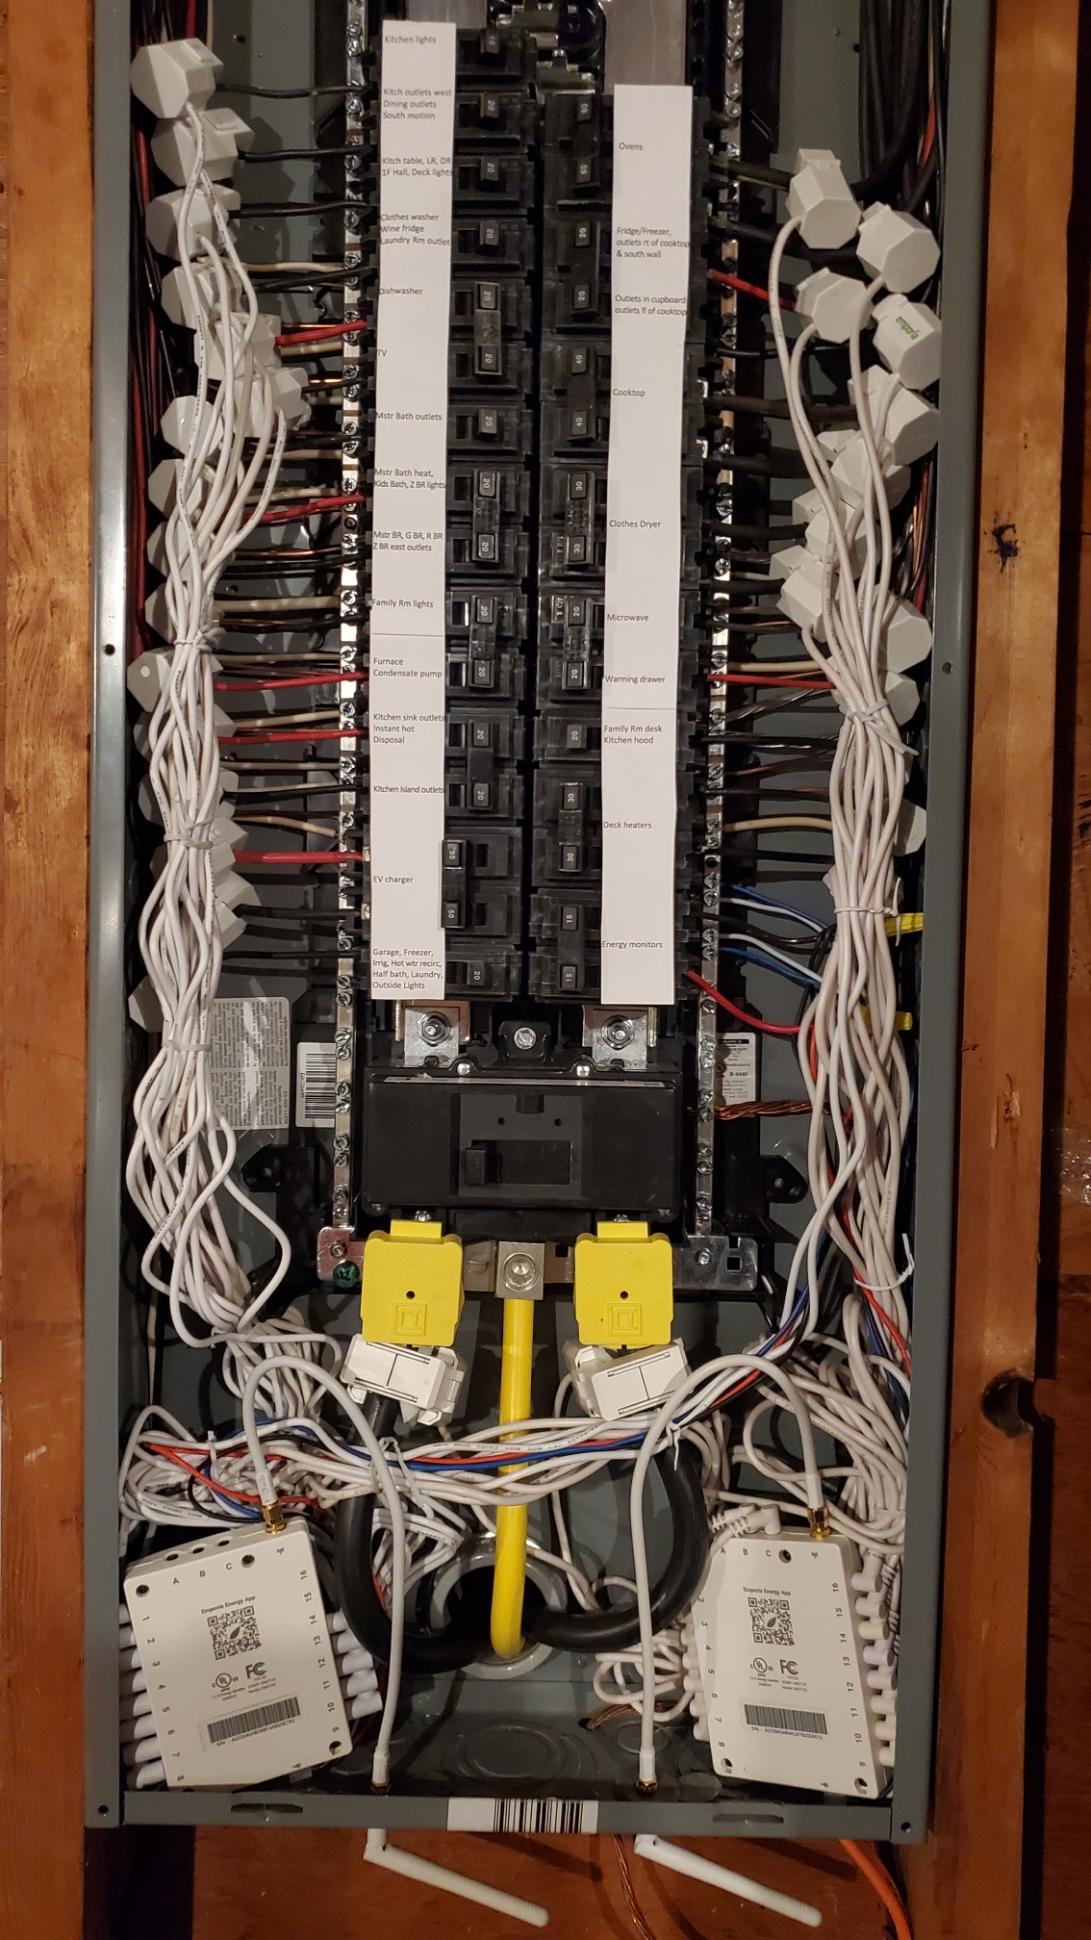
MemberI’m John. I live near Seattle. Thoughts about backup generator prompted me to investigate electrical usage monitoring. I have 2 Gen 2 units so that I can monitor all the circuits in my home panel. I’ve enjoyed learning about electricity and usage in our household. I’ll share graphs I’ve created and products ideas in separate posts.
-
AuthorPosts