Forum Replies Created
-
AuthorPosts
-
kpnobvious
MemberThanks @helgew!
I updated vuegraf’s code manually since i had made some customizations to it. I also updated pyemvue as there was a bug noted in there. I would suggest everyone else update as well.
I haven’t noticed a change in my graphing, but have seen a significant decrease in data point collection
The data points i was collecting dropped from about 4500 over 5 minutes with the older per second collection to 80 with the per minute collection.
MemberAlthough Ted never replied in this thread, there was a decent discussion in github and Jertel and Magico already made changes to help reduce some of the requests. So that covers two out of the 3 tools typically mentioned in this thread.
https://github.com/magico13/PyEmVue/issues/19
MemberThanks for posting and opening an issue on Magico’s github.
Do you think this is more related to device usage API requests? Maybe if there is no end time specified, it returns all values?
url = API_ROOT + API_DEVICES_USAGE.format(deviceGids=gids, instant=_format_time(instant), scale=scale, unit=unit)
Or maybe a chart request with no correctly formatted end value?
url = API_ROOT + API_CHART_USAGE.format(deviceGid=channel.device_gid, channel=channel.channel_num, start=_format_time(start), end=_format_time(end), scale=scale, unit=unit)
If you have the ability to post say the top 5 or 10 public IPs making the calls to AWS, that might help some users figure out if they are the problem. I think both Jertel and @helgew use pyemvue but may make their own posts to get the data
https://github.com/jertel/vuegraf
https://github.com/helgew/emporia-downloader
Also is there any progress on sending data locally say MQTT or maybe helping magico with some API documentation similar to what Flume has published for their water meter? https://flumetech.readme.io/reference
As I’m sure you’ve read from many comments in this thread, if there was a local option, there would be more customers and a lot less cloud polling.
MemberHi @Nrus2222, Magico posted something earlier, take a look here:
https://github.com/magico13/ha-emporia-vue
Memberhi @duunoit
Sure, I realized the change i was talking about in #1 was in the vuegraf.json file not in PyEmVue. To that end my vuegraf.json file looks like this in compared to https://github.com/jertel/vuegraf/blob/master/vuegraf.json.sample
Line 12 – name of your account, i believe this is done during setup
Line 17 – name of your Vue (under Device Management, Home & Circuits, Vue Info)After my last channel name, delete Jertel’s 2nd panel, so delete lines 27 thru 39.
You should be all set at that point, if it runs and the tagging doesn’t work, the json file is misformatted.
Thanks
MikeMemberThanks @Helgew! I’ll have to look at that again. I think if there some steps to compile it on Windows, that might help out a lot of people, particularly some of those looking for daily ranges. I presume you just need the JDK or even posted a compiled jar to github may help.
MemberDon’t worry @waterboyz, I’m old enough to know what those things are! I got into raspberry pis with Pi Hole for DNS filtering. There are a lot of youtube videos out there that can you get started.
Really with all these projects we’re just impersonating our emporia app accounts to log in and pull data locally. Potentially the things we do with the data could be added to the app. It seems from this thread there are about a dozen people give or take using the data. I’m very happy we have this ability at no additional charge. One of the reasons i bought the vue over other products like miser or sense was individual circuit monitoring and these open source projects that let me pull my data locally.
If you or @Bpendz get stuck, i can start a new thread about my setup.
MemberHi @Bpendz
Here’s a brief rundown:
1. PiZeroW with 32GB class 10 microSD
2. PiOS 5.4, fully updated
3. Install InfluxDB –
4. Install Grafana –
5. Install pip3 and supporting packages
apt install python3-pip, pip3 install pyemue, pip3 install influxdb, pip3 install influxdb-client
6. I git cloned PyEmVue to test , then git cloned vuegraf
I think i also did pip3 install -r requirements.txt from within each of the git folders to make sure i had all the requirements
7. Once i got pyemvue to pull back my data, i setup the json file for vuegraf.
8. Connect grafana to the influxdb for vue. Would probably be good to setup a reader account for grafana to the influxdbOnce everything was installed and running, i tested with pyemvue to make sure it would pull data. I then got vuegraf working as released.
Here’s where I began changing a few things:
1. I had to modify the sample JSON to get pyemvue to tag properly, or else everything showed up as the channel name\# from Vue. I can provide a sample if needed.
2. I modified a copy of pyemvue to change the logging from stdout to a log file and put in a for loop so it would run for 4.5 minutes before exiting. I still have it pulling data in the same range.
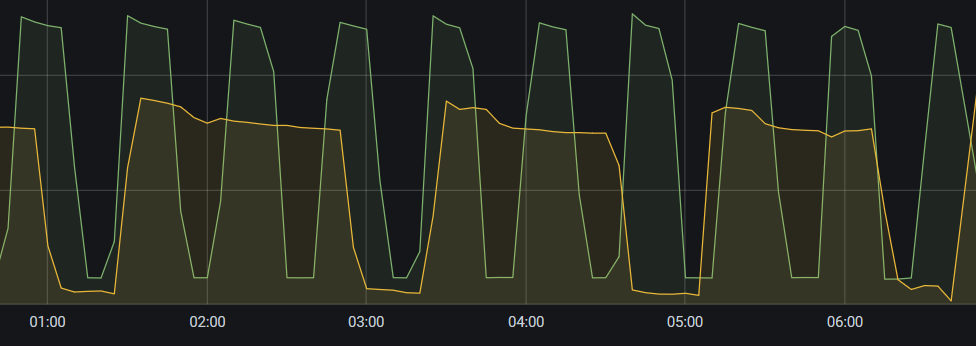
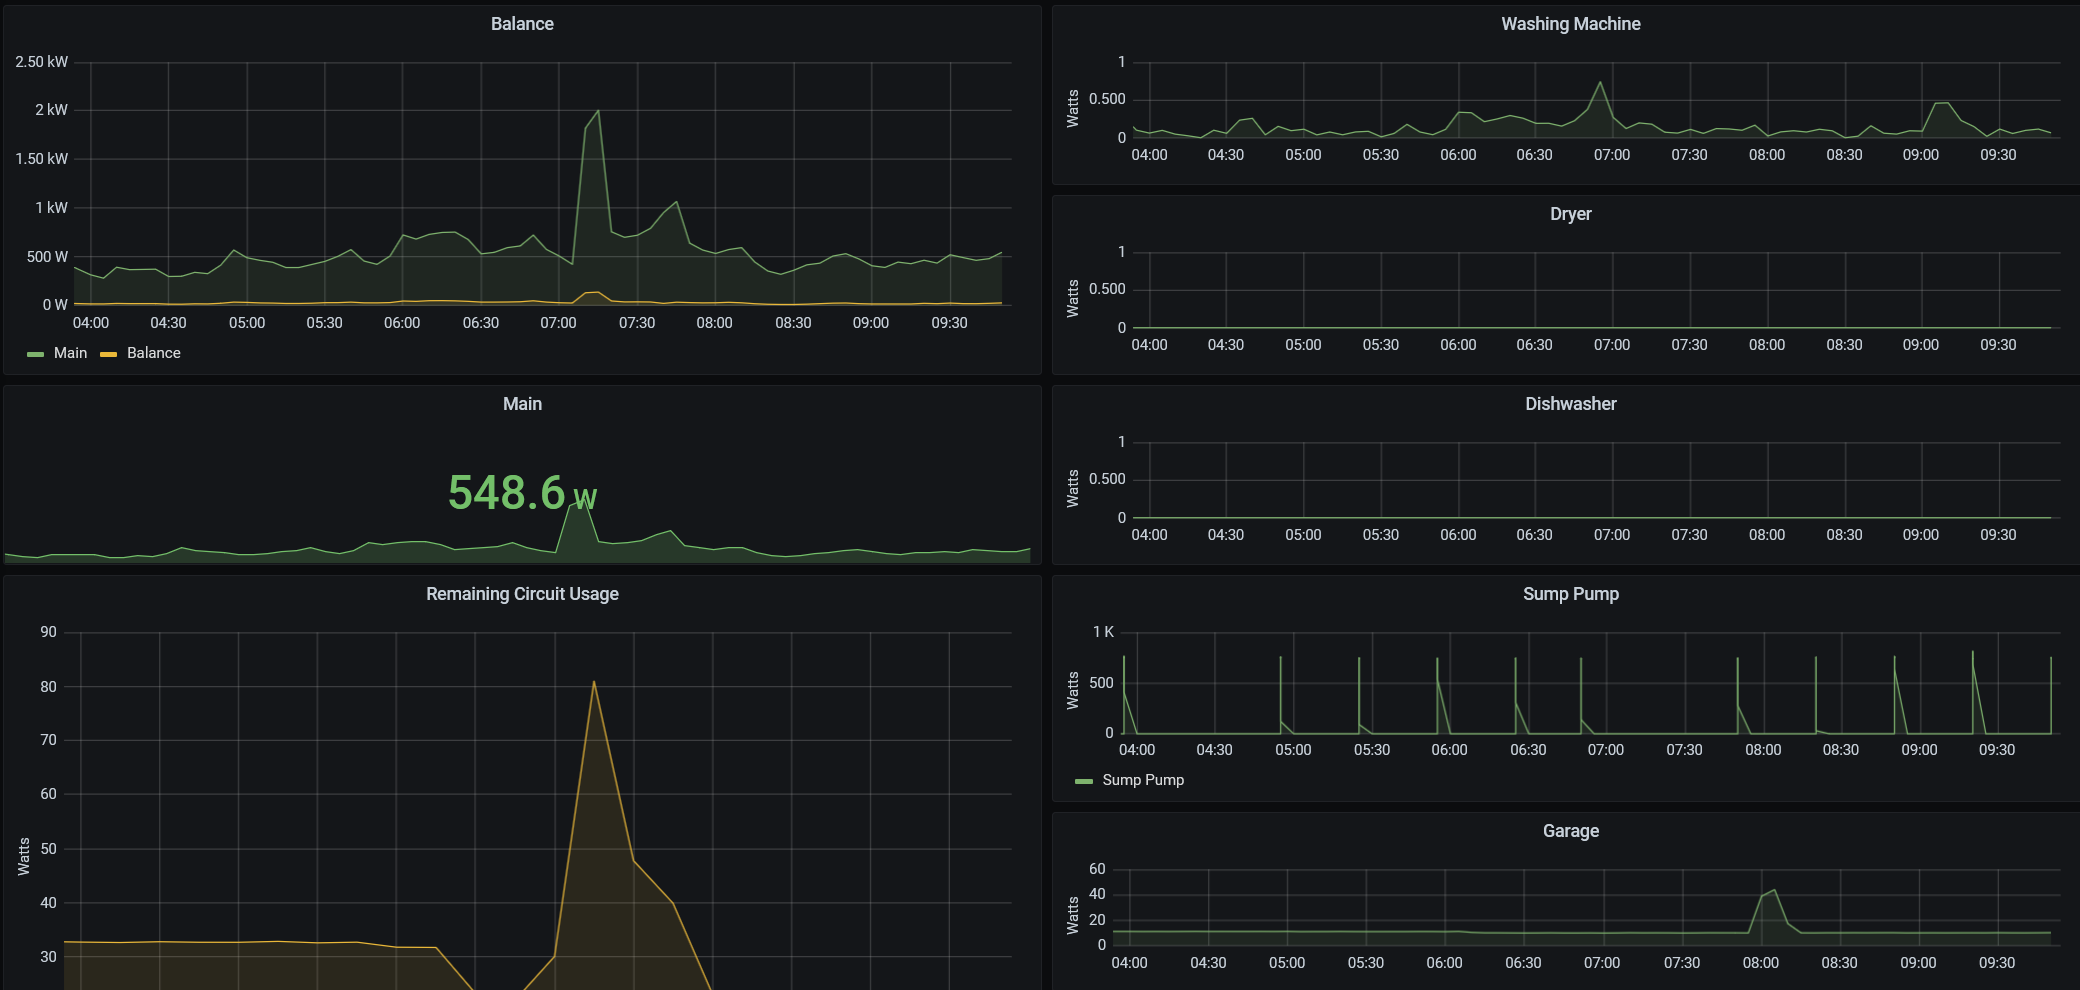
3. I created a launcher script to call my modified pyemvue script and added it to crontab running every 5 minutesI’ve spent some time messing with my grafana dashboard to suit my needs. So far i like it. I’m working on writing something using pyemvue to just pull usage by day as i havent’ figured out how to summarize the second data up by day and show a daily view in addition to the hourly views.
If i did it over again, i probably would have spent time figuring out dockers for everything with cloud backup. The vuegraf database isn’t actually very large so far, but i’ve only had it about a week.
In the end i have this:
 MemberMember
Hi,
I recently purchased my vue and got it installed. Part of the reason i purchased it was the ability to make API calls. There are already several projects mentioned in previous threads. I use a modified version of Jertel’s to pull the data into an influxDB to graph with grafana. I just use a raspberry pi to do it. It was fairly straightforward to setup.I know emporia’s API isn’t as well documented as say EcoBee or Flume but thanks to some of the folks here the ability to get the data is out there. While that does require an internet connection, i really don’t think that’s an issue, nor do i see some sort of local API being implemented.
I can share some steps if people are interested. I changed Jertel’s github project to run periodically vs continuously and worked out a simple dashboard in grafana. I just need to work on some longer data views, like sum by day.
-
AuthorPosts