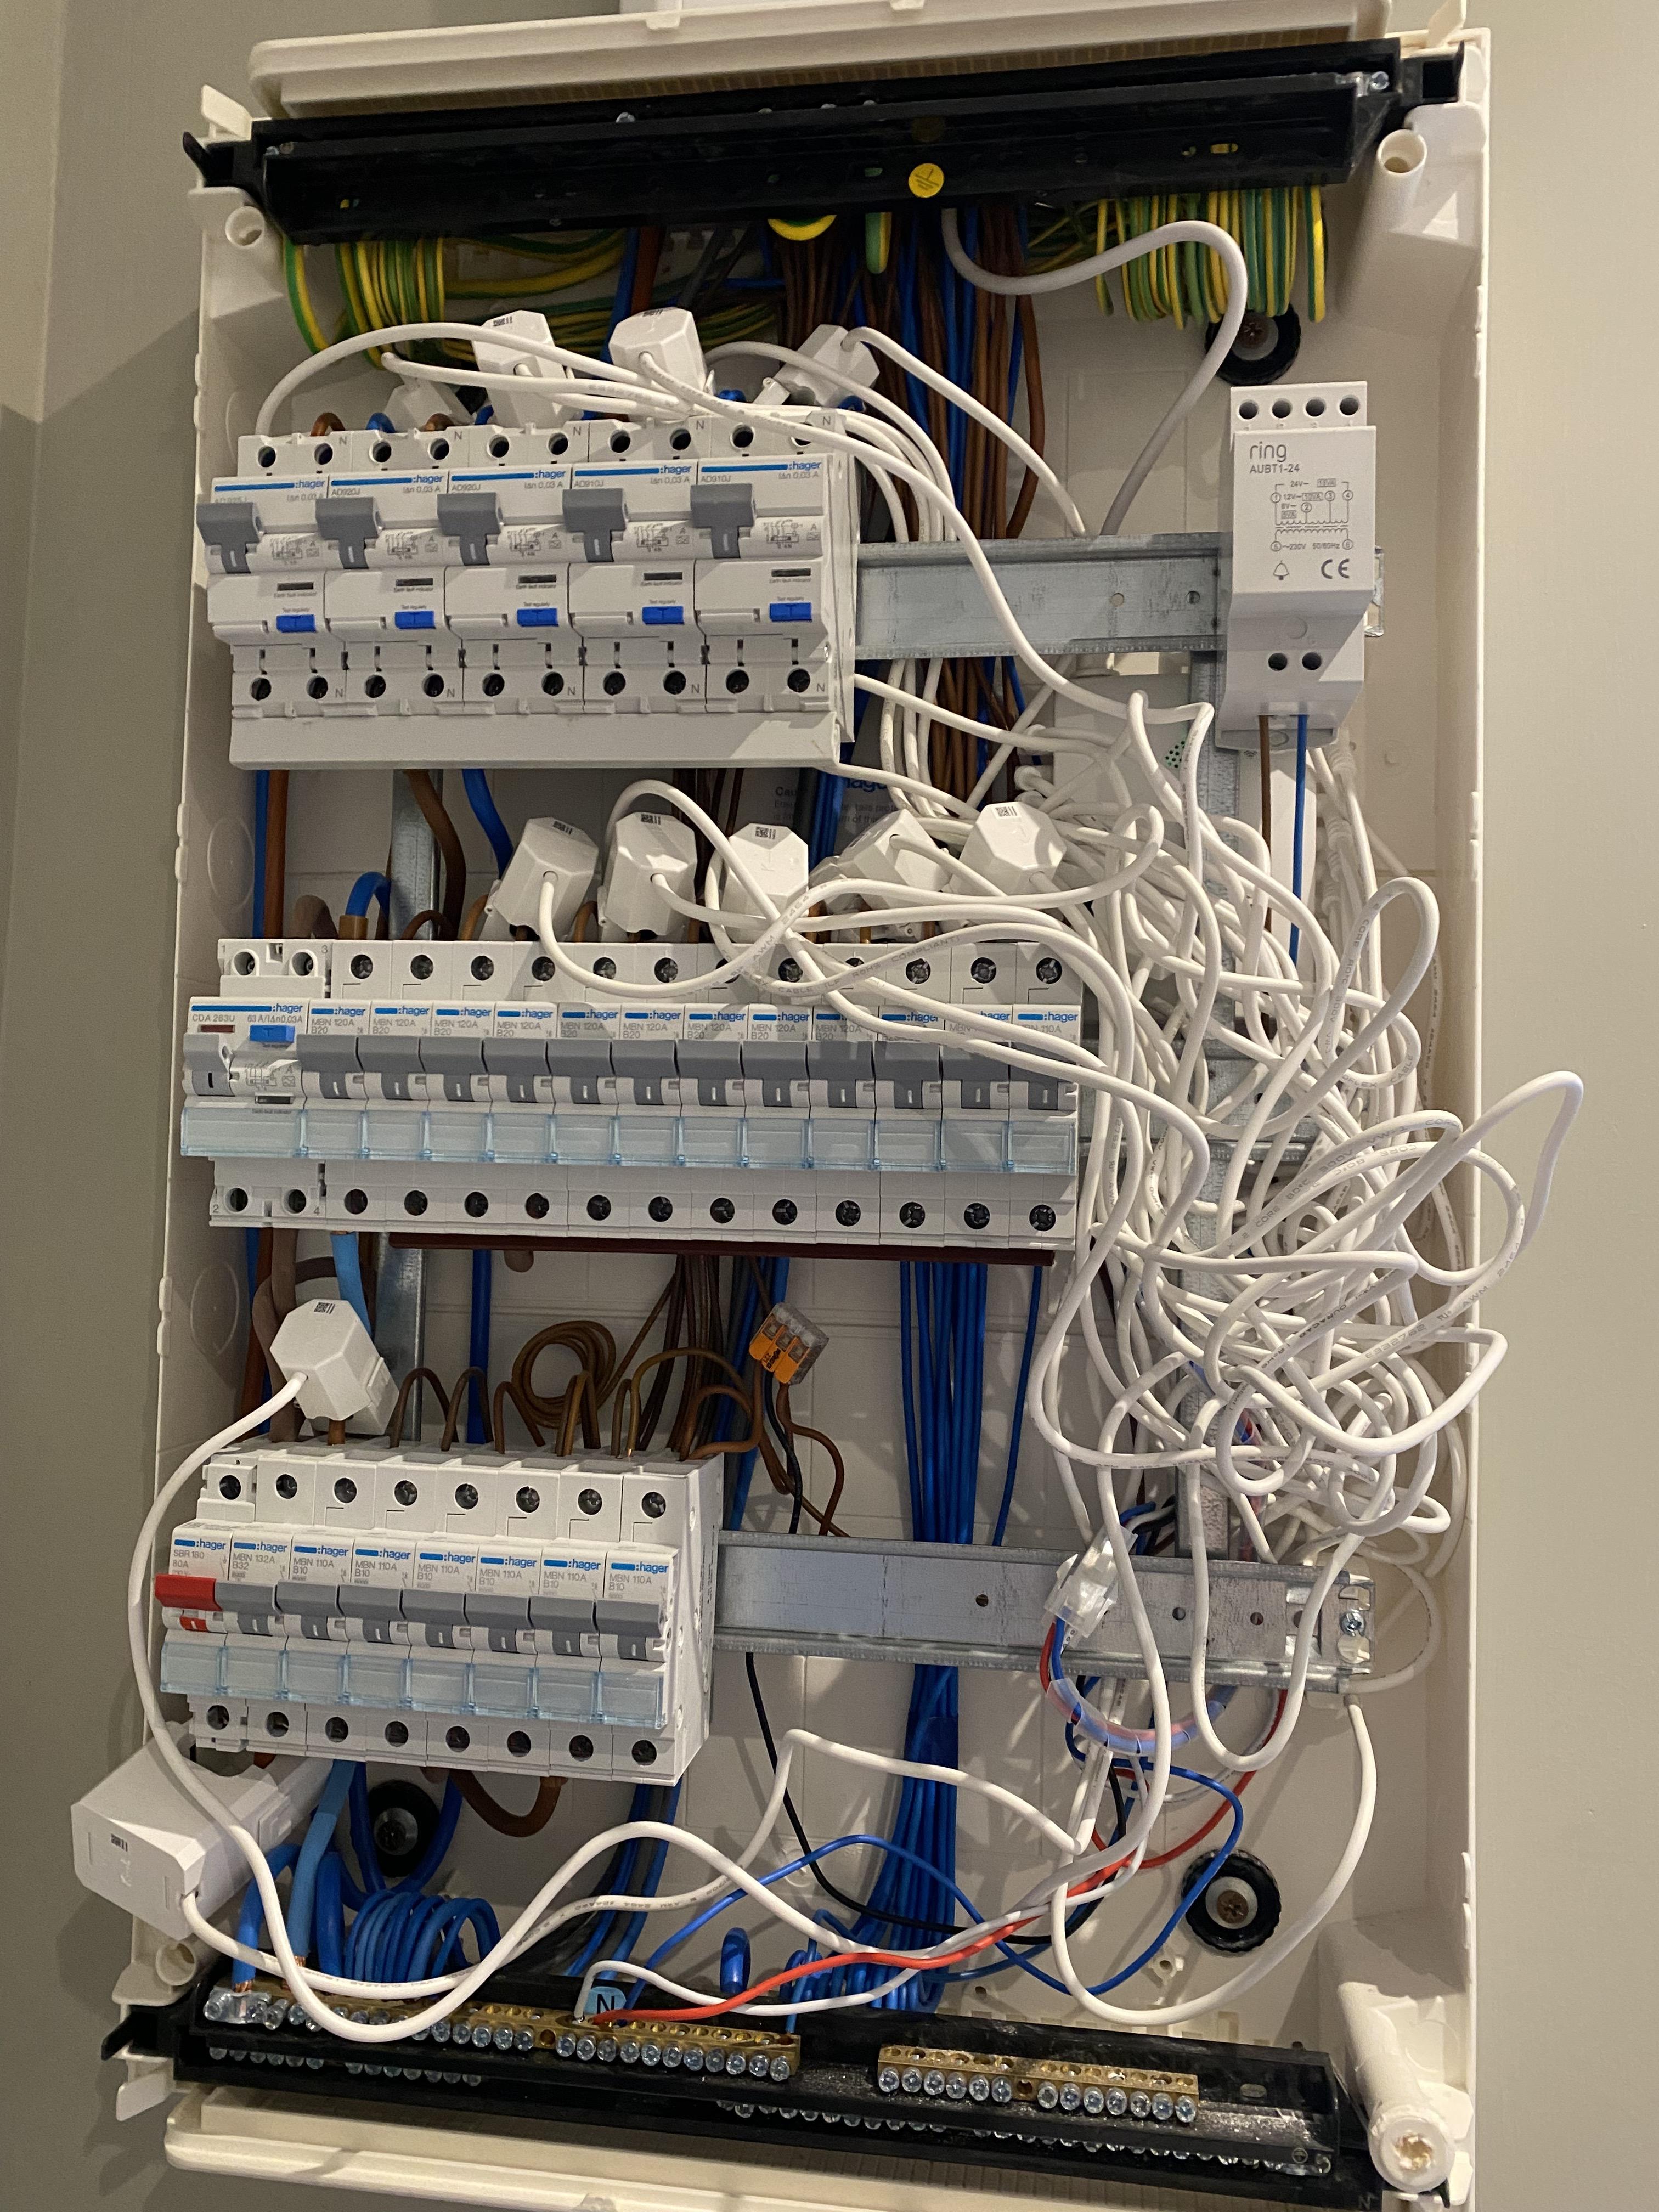
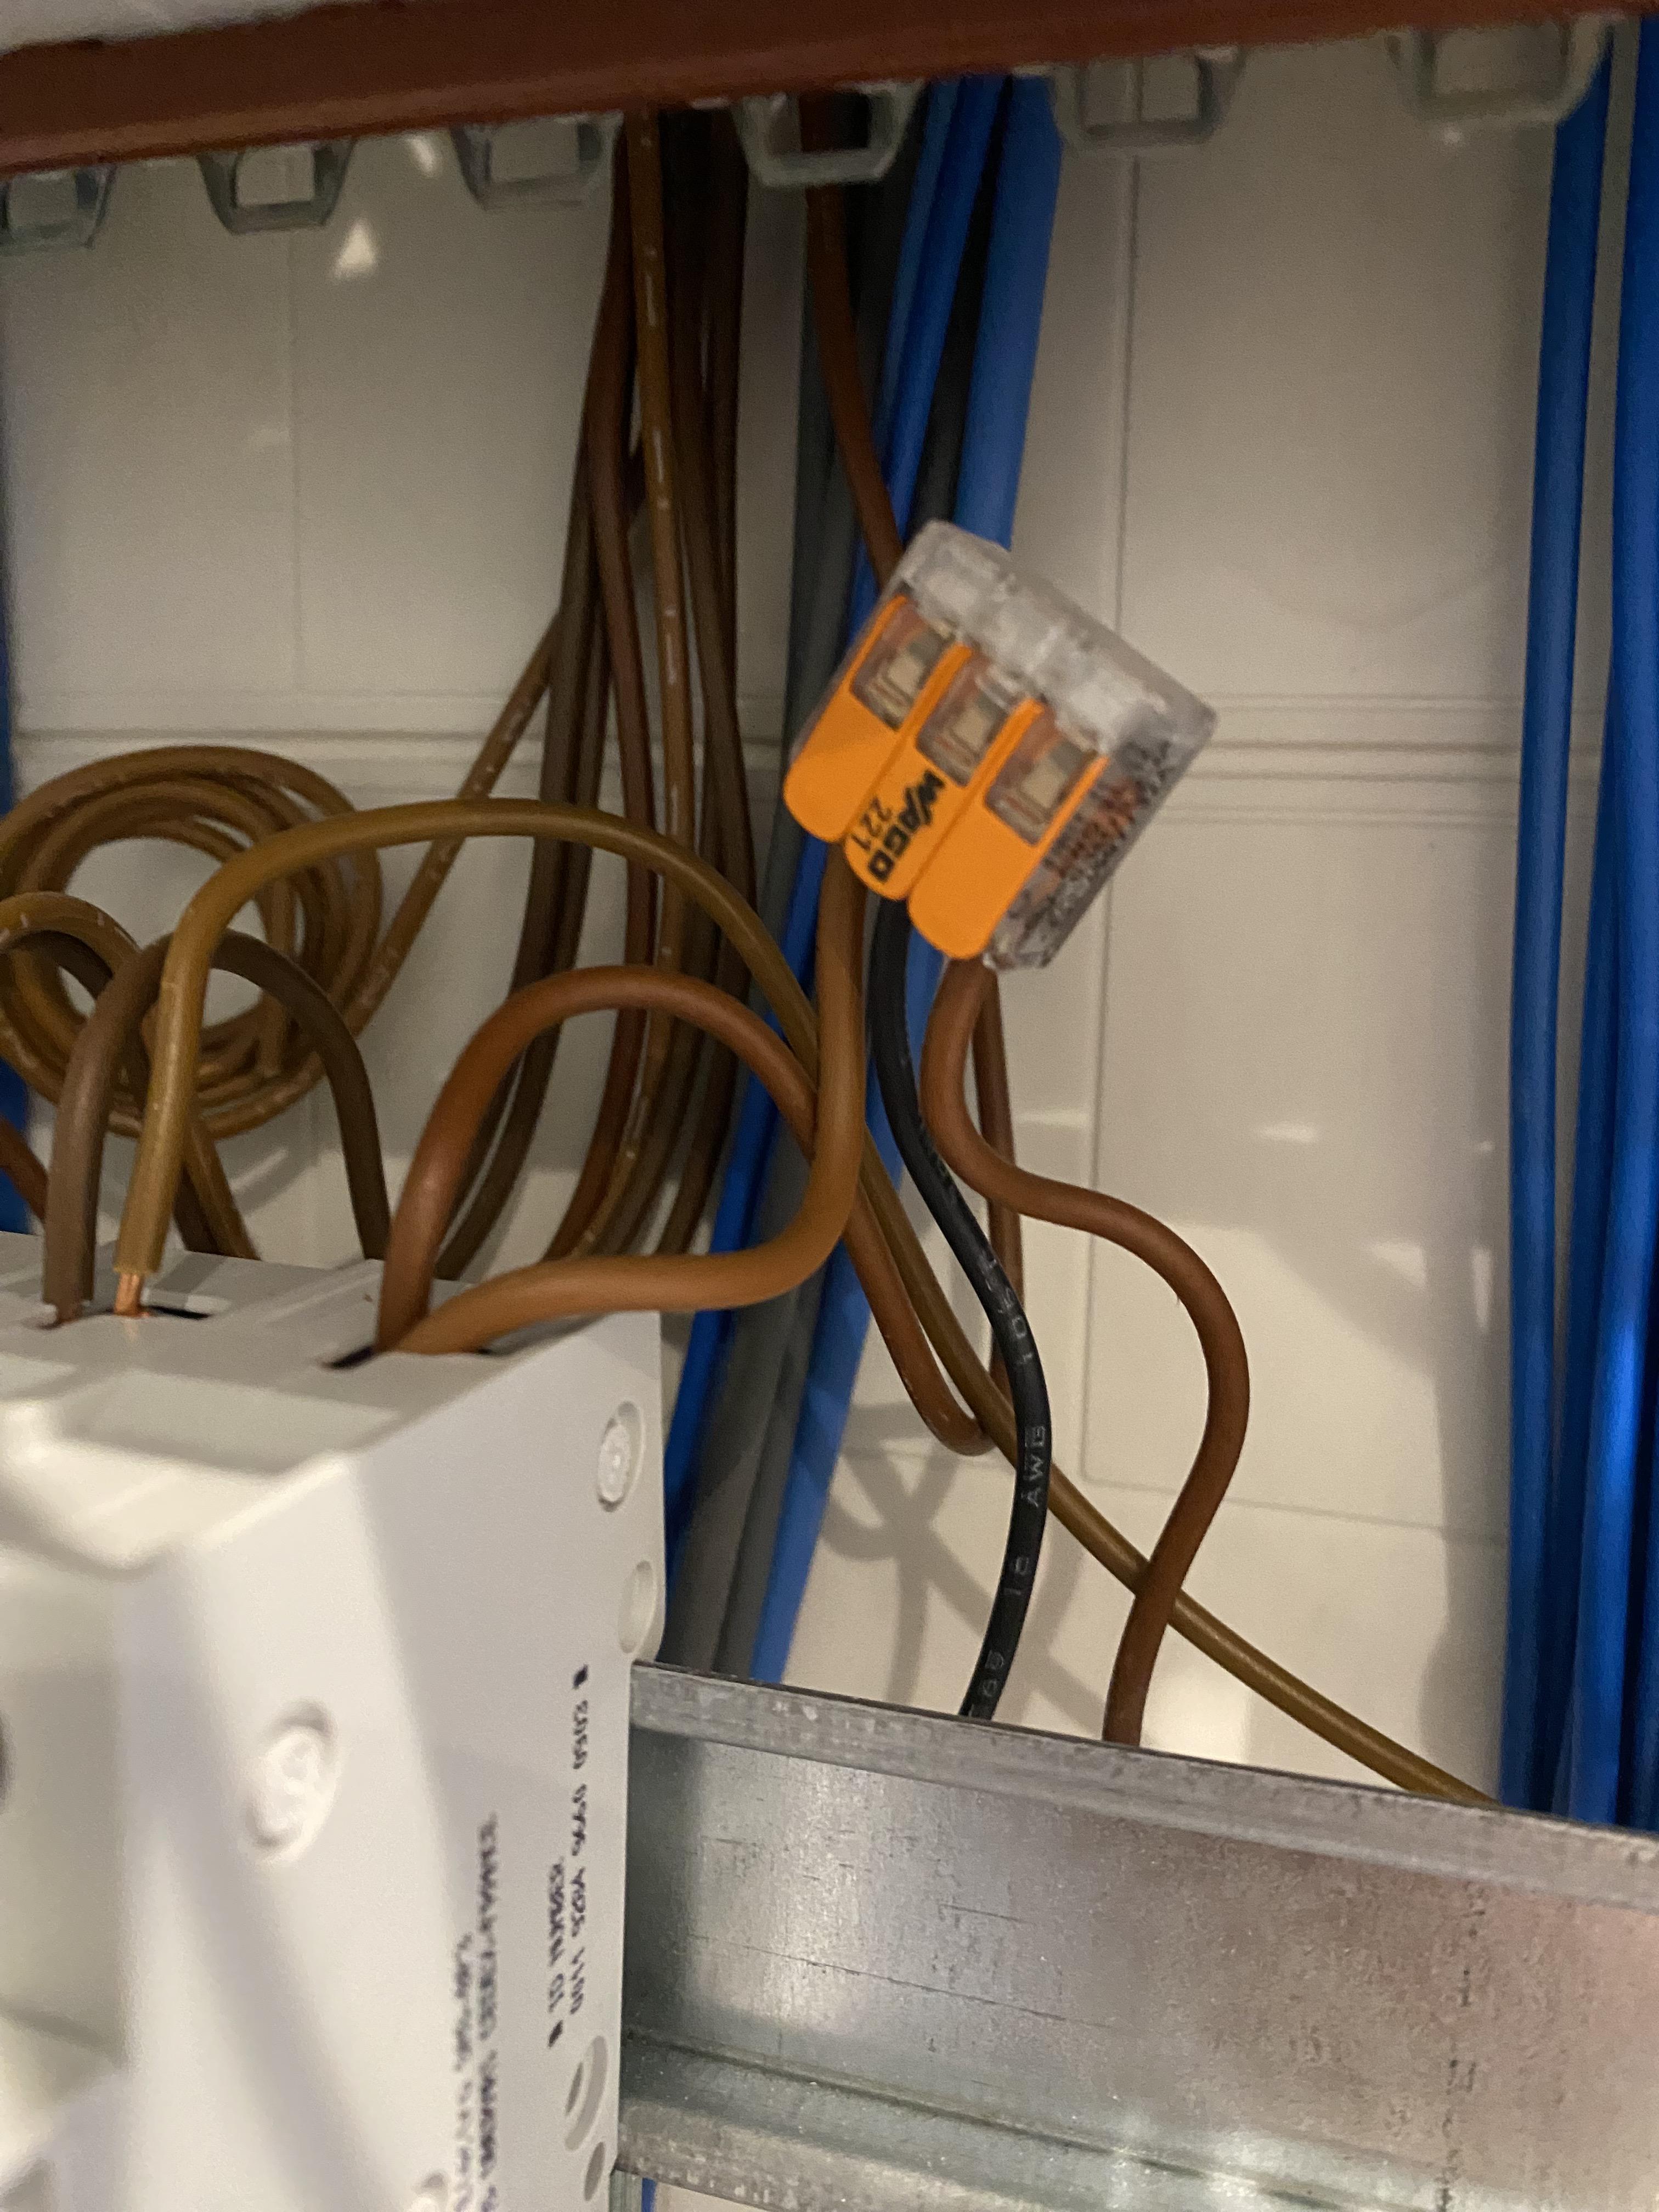
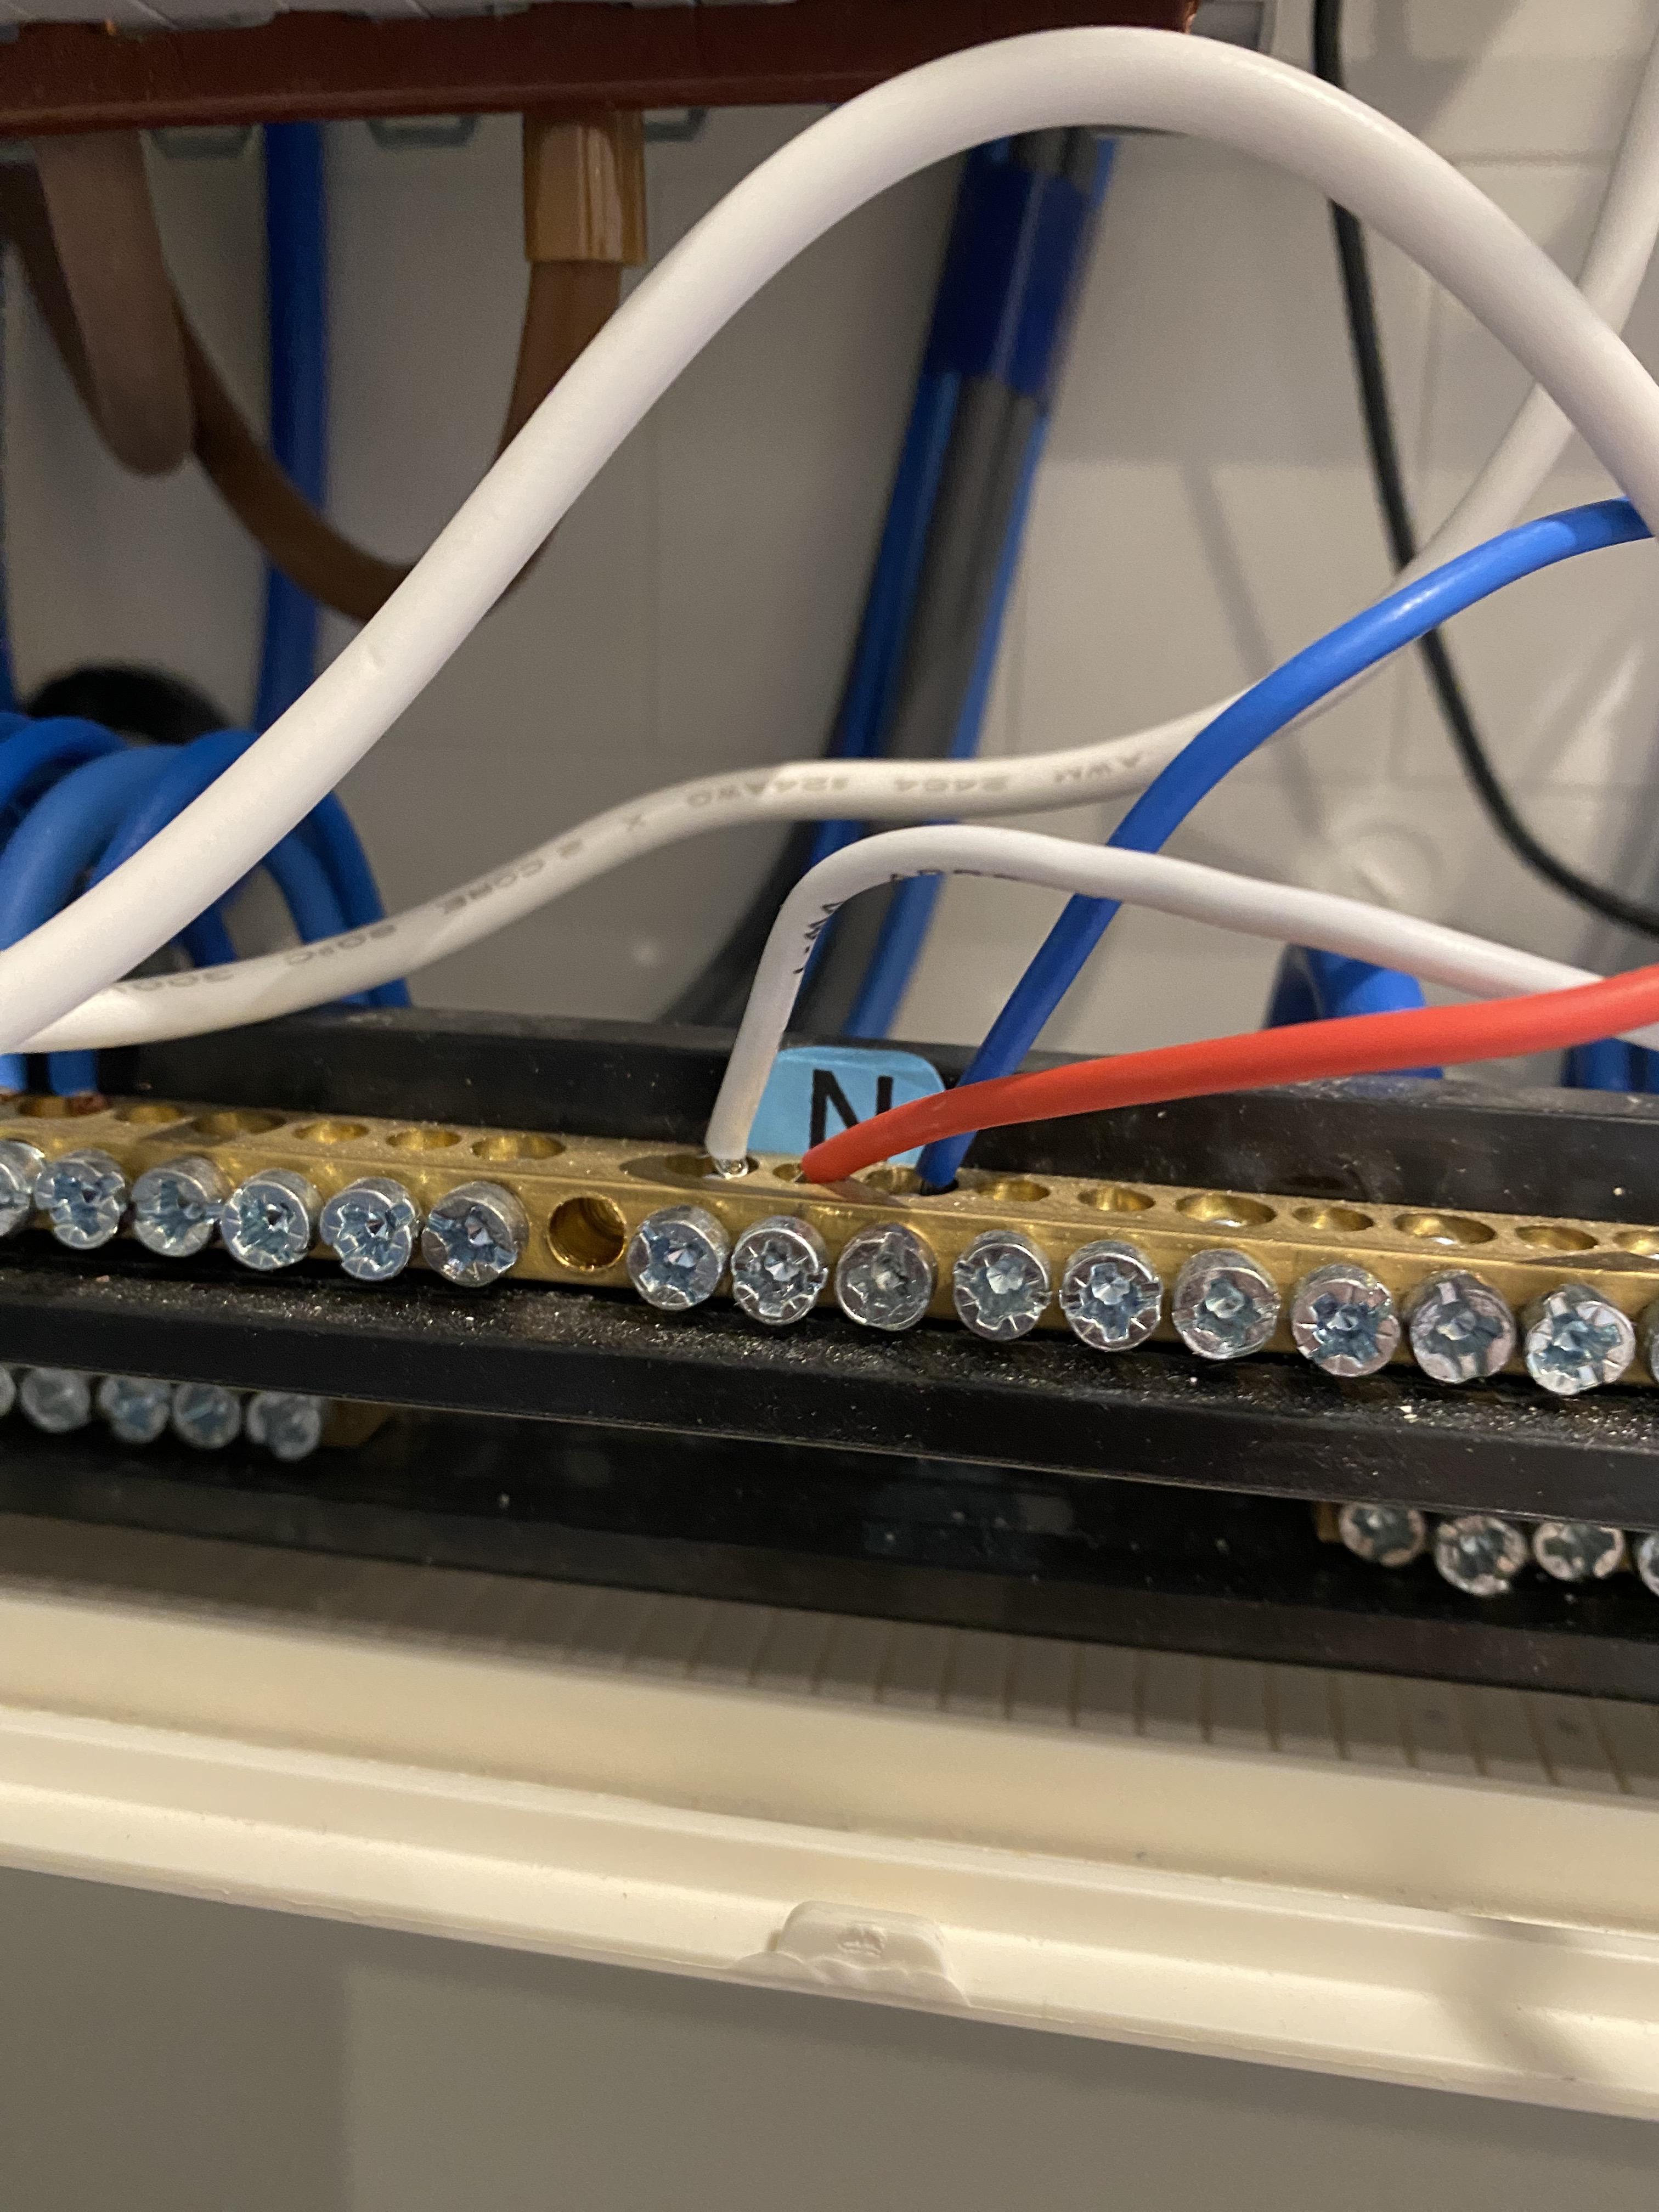
This balance figure has me really confused. Why would it still show a balance figure of greater than 50% total consumption – if all circuits not clamped are switched off at their breaker? Do I have this wired correctly?


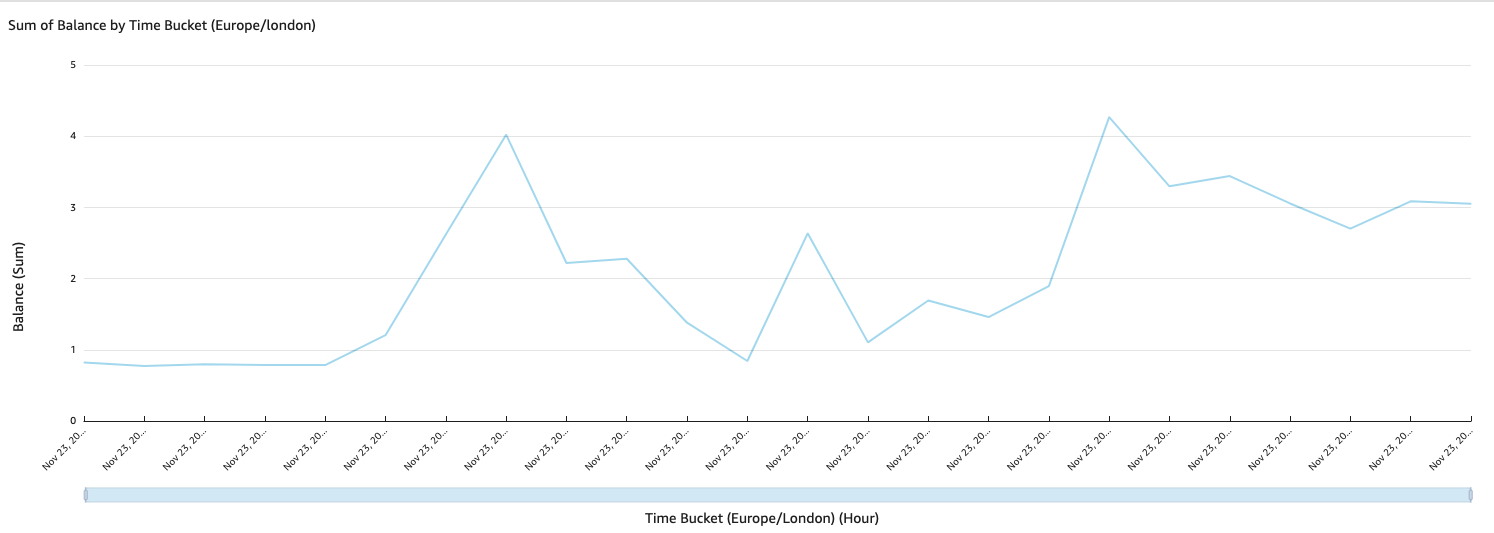
I have visualised the Balance demand figures over the last 24 hours. This is not constant, which I would expect. Each x-axis time segment is a one hour point in time, starting at midnight.
