Emporia Energy Community › Product Ideas › Allow graphing of Total Usage and Balance
- This topic has 11 replies, 7 voices, and was last updated 2 months, 1 week ago by
mrye.
-
AuthorPosts
-
-
Squash_pro
MemberTotal usage is one of the most useful values when one has a solar system. Because one’s solar system output varies day to day and over the seasons, its difficult to track how one’s actual daily consumption is trending without graphing Total Usage. Unfortunately, I can’t find any way in the application to graph it.
I often also have a frequent need to graph Balance, as I don’t have enough sensors to track everything. For example, one of my 3 a/c compressors is in the Balance category. If i want to see how often it is turning on, or how long it is staying on, then i can’t currently do this without downloading all the data and creating my own spreadsheet. Being able to graph balance would really help, as the compressor current draw is high enough that it dwarfs the other stuff in that category.
The way that the auto-scaling works when scrolling through a graph is also something that needs improvement. One scrolls through the data only to have the scale change. It often leads to confusion until I finally figure out what has happened. It would be nice to be able to click a button to “hold’ the scale at the current values while scrolling.
-
yyzguy
MemberYeah, the scale change when scrolling is annoying. I think others (maybe myself even) have asked about that in the past. Seems there’s been very little activity from the devs in quite some time.
How about putting that third compressor on its own CT and leave your smallest loads unmonitored? Shortly after installing my own system, I quickly figured out which circuits use the least amount of energy and left those unmonitored. My balance never exceeds 5%.
-
This reply was modified 10 months, 1 week ago by
yyzguy.
-
emporiacs
Emporia StaffWe haven’t given up on this feature, and it is still planned to be released just as soon as possible.
We are doing our best to build the many feature enhancements on our roadmap – both those requested by our customers and those that will make Emporia the best Smart Home Energy Management service available. We maintain a very small development team in order to ensure this service remains free to you. Their priorities are often adjusted to fix critical customer facing issues or to build features that will have the broadest impact to our customer base. I will definitely pass your feedback on to the team. Rest assured, we have not lost track of this enhancement. To make sure you get emails when new features are announced, please make sure you are subscribed to our mailing list at http://eepurl.com/gxAMZv
We appreciate your support and understanding.
-
This reply was modified 10 months, 1 week ago by
-
Emporia Staff
This is on our list of item to get added, along with in/out grid and balance. Currently any ‘calculated’ measurement is not graphed.
-
Emporia Staff
This is on our list of item to get added, along with in/out grid and balance. Currently any ‘calculated’ measurement is not graphed.
-
Sikevski
MemberNot having the ability to see what the total load being drawn is ridiculous – it was one of the primary features I invested in Emporia for! Load monitoring of the system is a basic requirement. Having added Solar, I now have no idea what my total energy use is. Maybe take a leaf out of myenergi’s book and take a look at their app and the simple way they indicate the load drawn, solar generated – as well as monitoring the load to their hardware. Other than looking at circuit load detail, the emporia app has become pretty redundant (my solar system app gives me detail on yields etc.)
-
Emporia Staff
We can measure total usage as long as you have are monitoring solar with our sensors(see below). We definitely agree our app needs improvement and have that on our radar. Thanks for your suggestion to look at Mvenerai’s!
-
-
Member
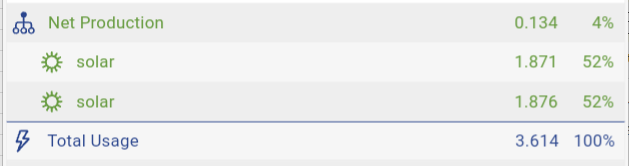
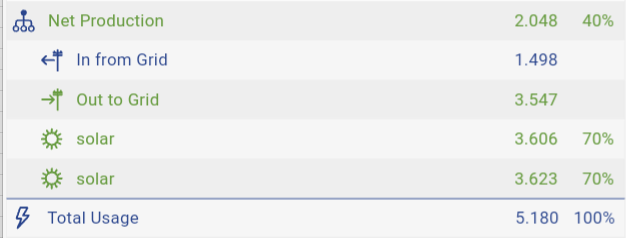
I am similarly frustrated by the inability to graph “total usage”.
I have sensors on the solar lines coming into my panel. I also have sensors on the main lines that run from my breaker panel to the meter. This gives me a lot of nice information. If I enter the Emporia app and hit the “graph” icon, then hit “day”, I will see how much power I drew from or pushed into the grid on that day. The numbers for each day correspond very closely to what is shown on the myPGE website. I can click on my “solar” line in the main screen, select day for the interval, and then see my total solar generation for each day.
The one metric that I also track is how much power I am consuming each day. Sometimes I see unexpected anomalies in consumption that cause me to investigate what is going on or take steps to reduce high consumption activities. However, the only way that I can easily see trends in my total power consumption is to download the data and use a spreadsheet to track it myself.
I recognize that total usage is a calculated figure and consequently may not have specific entries in the database that holds the measured sensor values. But isn’t net usage (which is graphable) also a calculated value? Can’t the same technique as is used for net usage be used for total usage?
My bottom line is that graphing total usage is highly desirable for those people who want to manage their power consumption. Isn’t that the center of the Emporia target market?
-
MikeBean
MemberOne more vote for this feature. I have a large residual balance and my panel has more breakers than I have CTs so tracking down the culprits is difficult without some indication of the profile of the usage balance.
-
Vue2user
MemberI’m also a solar user in a TOU area and I need total usage to help decide how much solar battery(s) I need. I’m considering only getting smaller (Ecoflow-type) batteries for the areas that use the most daily load (like my Cable, Network, Sterio closet) and my gaming computer room so I can load shift those heavy use areas. It’s cheaper than ugrading the whole house to battery storage. I need to be able to see total usage graphed to make sense of the data.
-
Emporia Staff
Hi,
Balance is a calculation and we don’t graph calculations at the moment.
We’ve relayed this feedback to the team.
-
-
mrye
MemberI have an External Solar System meaning my connection bypass’s my main electrical panel and for goes to the grid through another meter. I added a CT to monitor for my “Solar Circuit”. I have asked about having an “External Solar” selection that would subtract in the Total Usage instead of currently adding. Would this be apart of what is currently being worked on?
-
-
AuthorPosts
- You must be logged in to reply to this topic.