Emporia Energy Community › Product Ideas › App data and graph improvements
- This topic has 5 replies, 3 voices, and was last updated 7 months, 2 weeks ago by
emporiacs.
-
AuthorPosts
-
-
amp_master
Member3 improvement suggestions:
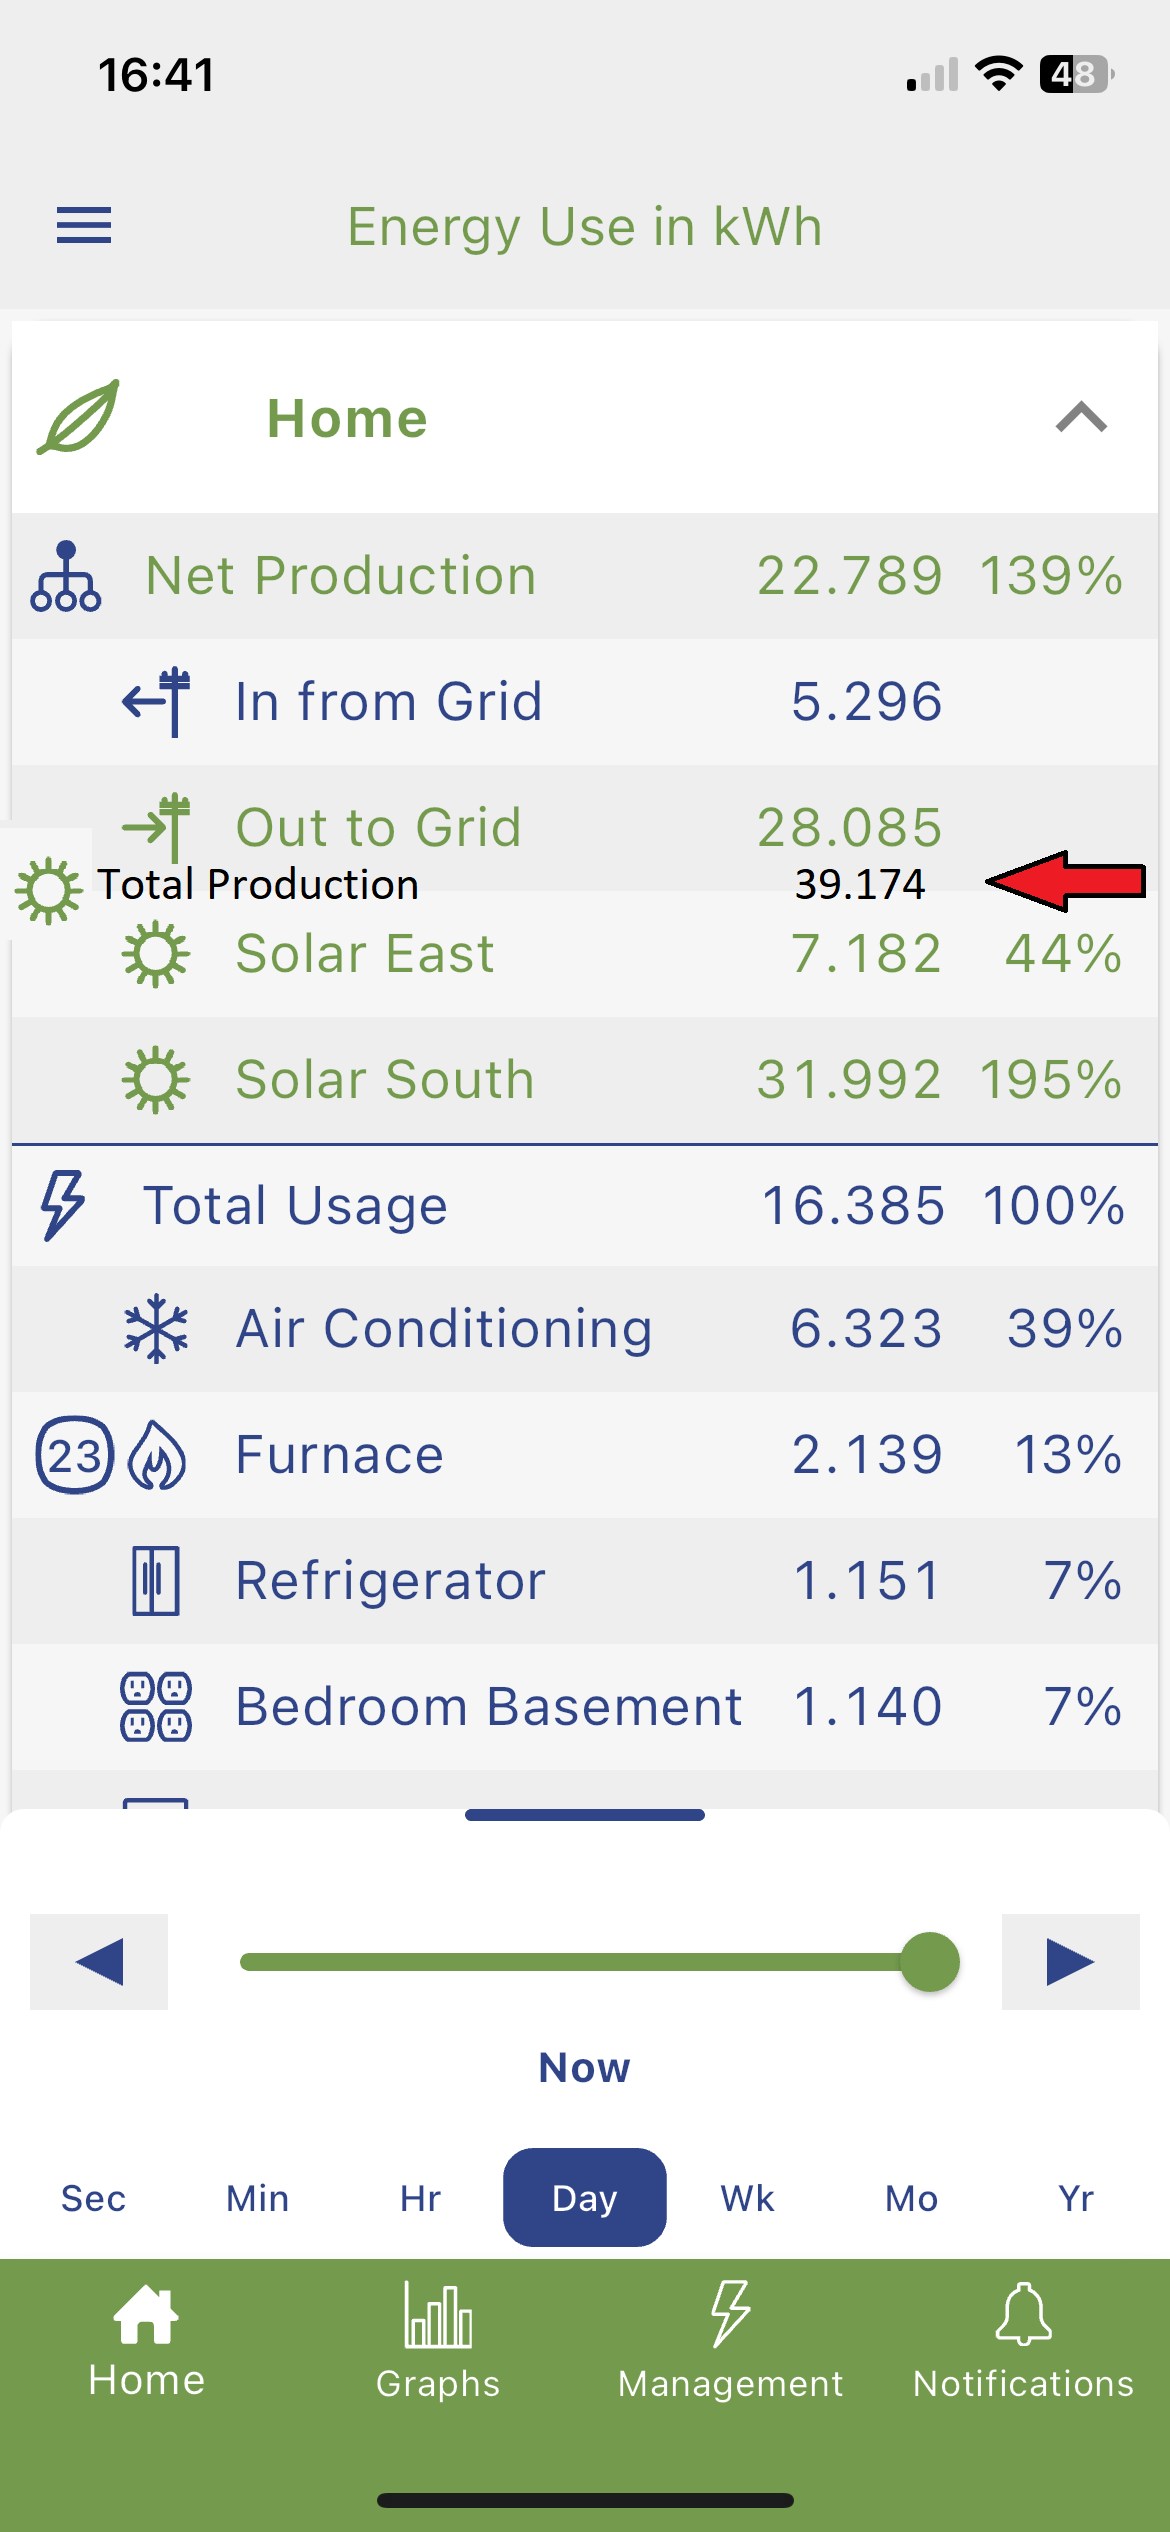
1-We need a “total production” line that sums up all CT flagged as producers same way as as there is a “total usage”. I have two solar arrays measured separately by two CT, i like to know what each array produces, but i also need a quick/simple total production (not net production) as well.
2-The green/blue lines isn’t the best way to show positive/negative consumption (color blind people like me can’t really see it, and it’s not readily intuitive). We need surplus/export electricity produciton showing as a negative consumption on the graph (below the zero axis) and net consumption as a positive (above the zero axis as today). I had an instance where i was at 1.4kw net production then my 2800W A/C kicked in, and the graph showed it as a perfectly flat line (just that green line changed to blue line).
3-The graph scale needs to be fine tuned. A) when loads are small (like 22 watts), the graph units needs to be watts and not kW because load in kw is between 0.02 and 0.02… not great; and B) scale needs more logical division such as multiples of 1, 5 or 10, instead of random numbers like multiples of 0.88 or whatever it is at the time.

-
emporiacs
Emporia Staff1.) Circuit merging (feature request mentioned here) is our #1 requested feature, hoping to get that added in the future (no timeline though, and certainly discussions about that available on the forum).
2/3.) Looking to update graphs in the future, however a pretty big app overhaul. Once we have the app in a good place to approach graphing updates we’ll certainly be adding some of these features as well.
-
Member
For my point 1)
I’m not suggesting circuit merging, but just a line item called “total production” that sums all of the CT circuits that are producing power (i.e. I don’t want my East and South solar arrays to show up as a single merged line item, I still want them separate, but I need, as we have a “total usage” for all loads, a total for production.)
-
Emporia Staff
Thanks, will share with request with our development team.
-
-
MAuser
MemberI’m glad to see the common community interest in the items at the top of my wishlist (graph total and excess consumption, fix the positive-negative problem). I have a few more to add:
1) I’d like to be able to plot multiple circuits simultaneously in different colors.
2) I’d like to be able to pick which circuit(s) I’m viewing on the plot without having to go back to Home and back again.
Both of these could be accomplished with a picklist on/from the plot screen.
The common scenario here is that I see that there was a burst on the Net Usage plot and want to figure out what circuit it was. Ideally, I would zoom/scroll the plot window to the right time frame and then click through the circuits to figure out which one it was.
-
Emporia Staff
Thanks for the suggestions, we’re planning on adding them in a future firmware update.
-
-
-
AuthorPosts
- You must be logged in to reply to this topic.