Blue vs Green bars in Energy graph

Emporia Energy Community Support Center Emporia App Blue vs Green bars in Energy graph

Viewing 2 reply threads
  • Author
    Posts
    • #9213 Report Abuse
      NK
      Member

      Why are some bars blue and others green?

    • #9214 Report Abuse
      djwakelee
      Member

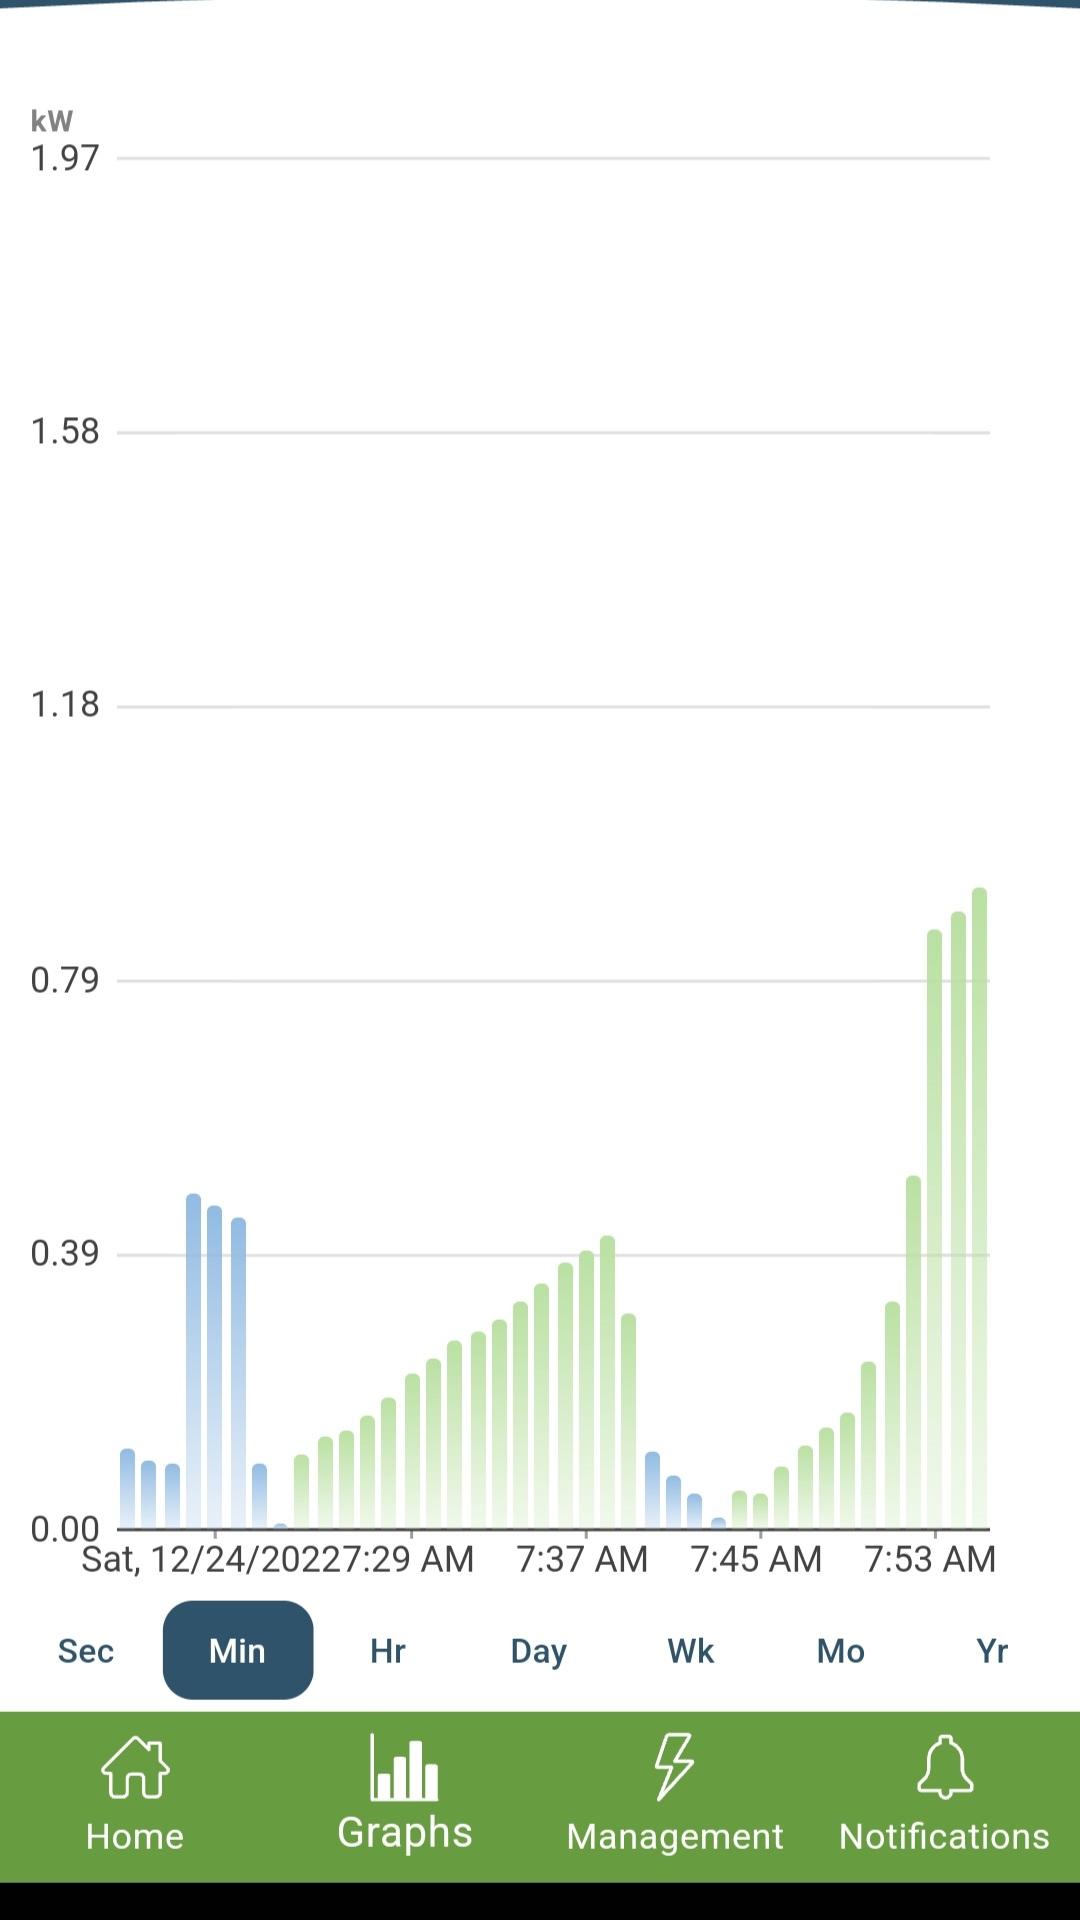
      Consumption from the grid vs. excess surplus Production back to the grid.  That is normal if you have grid tied solar, and don’t consume everything you produce.  If you don’t have solar, something isn’t setup correctly.

    • #9215 Report Abuse
      NK
      Member

      Better graphical representation would be positive bars (going up) in green for Production, and negative bars (going down) in blue for Consumption, with a net usage line going across the bars.

      Just my $0.02

Viewing 2 reply threads
  • You must be logged in to reply to this topic.