Has anyone ever seen anything like this

Emporia Energy Community Support Center Emporia App Has anyone ever seen anything like this

Viewing 1 reply thread
  • Author
    Posts
    • #8415 Report Abuse

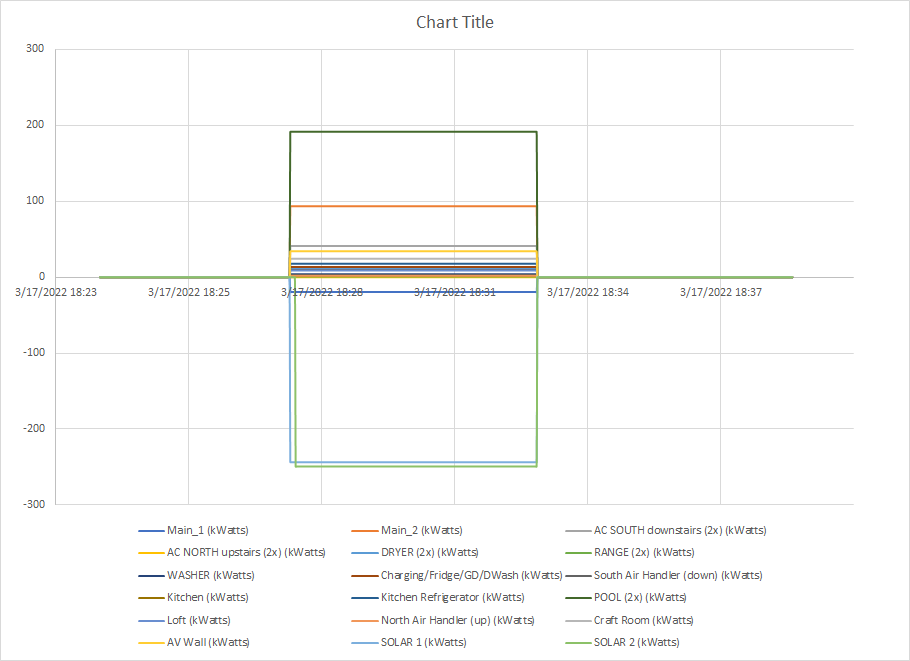
      This is an Excel plot of my VUE data between 6:25 and 6:34 today at 1 second resolution.

      The dark green line at goes to 200 kW is my pool pumps which were turned off at the time.

      The orange line is one of my two 200A service lines.

      The first negative value is my second 200A service.

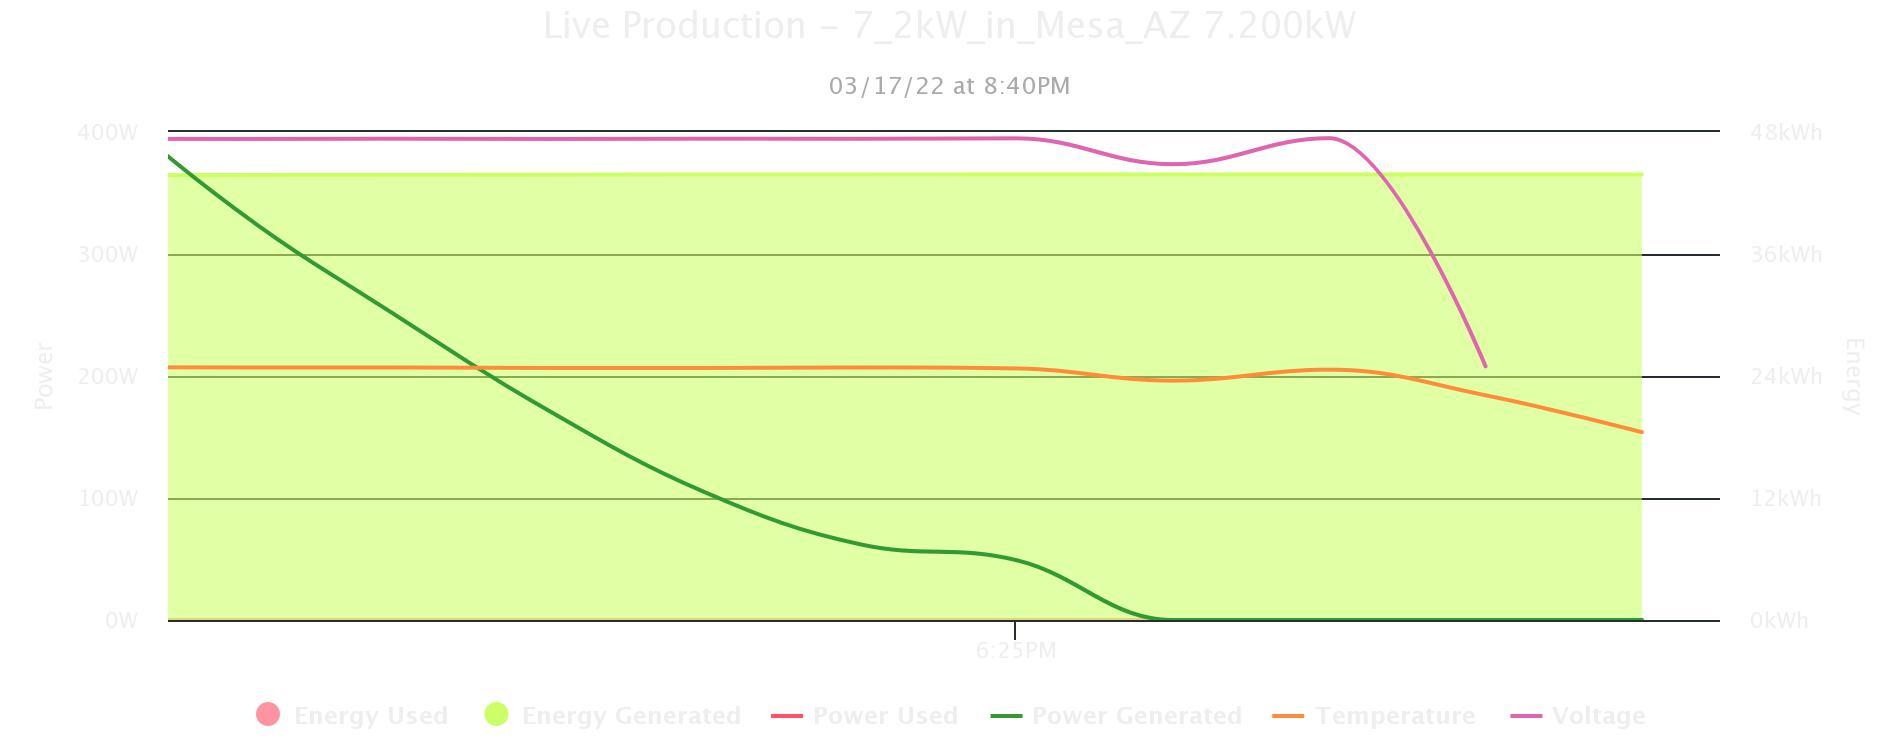
      The very bottom two blue and green lines are my two solar back feed lines.  As you can see from PVOutput, the occurred right at the end of my solar production day.

      https://community.emporiaenergy.com/wp-content/uploads/hm_bbpui/8415/i5ui14nasv6wrdgcba2l4gh3qndjabq8.png

    • #8420 Report Abuse

      And here we go again…

Viewing 1 reply thread
  • You must be logged in to reply to this topic.