Emporia Energy Community › Product Ideas › Visualizing Usage – Graphs help explain impacts of loads and overall usage
- This topic has 3 replies, 3 voices, and was last updated 10 months, 2 weeks ago by
Greg.
-
AuthorPosts
-
-
johnsko
MemberI learned quite a bit about my own household electrical usage and about the relative loads of various appliances by graphing and analyzing usage over time. It took quite a bit of time (in Microsoft Excel) to create the graphs and analysis. Storing customers’ data has already gotten expensive enough that Emporia has reduced data retention. Consider offering a premium service in which data is not only retained for longer periods but also includes analysis.
Here’s what I did and what I learned:
- Combined a month of data from 2 Gen2 VUEs. (That’s 44 thousand minutes.)
- Grouped usage into 8 categories, 4 “peak” (infrequent but significant loads) and 4 “base” (consistent loads).
- Made charts to visualize and analyze consumption, included below.
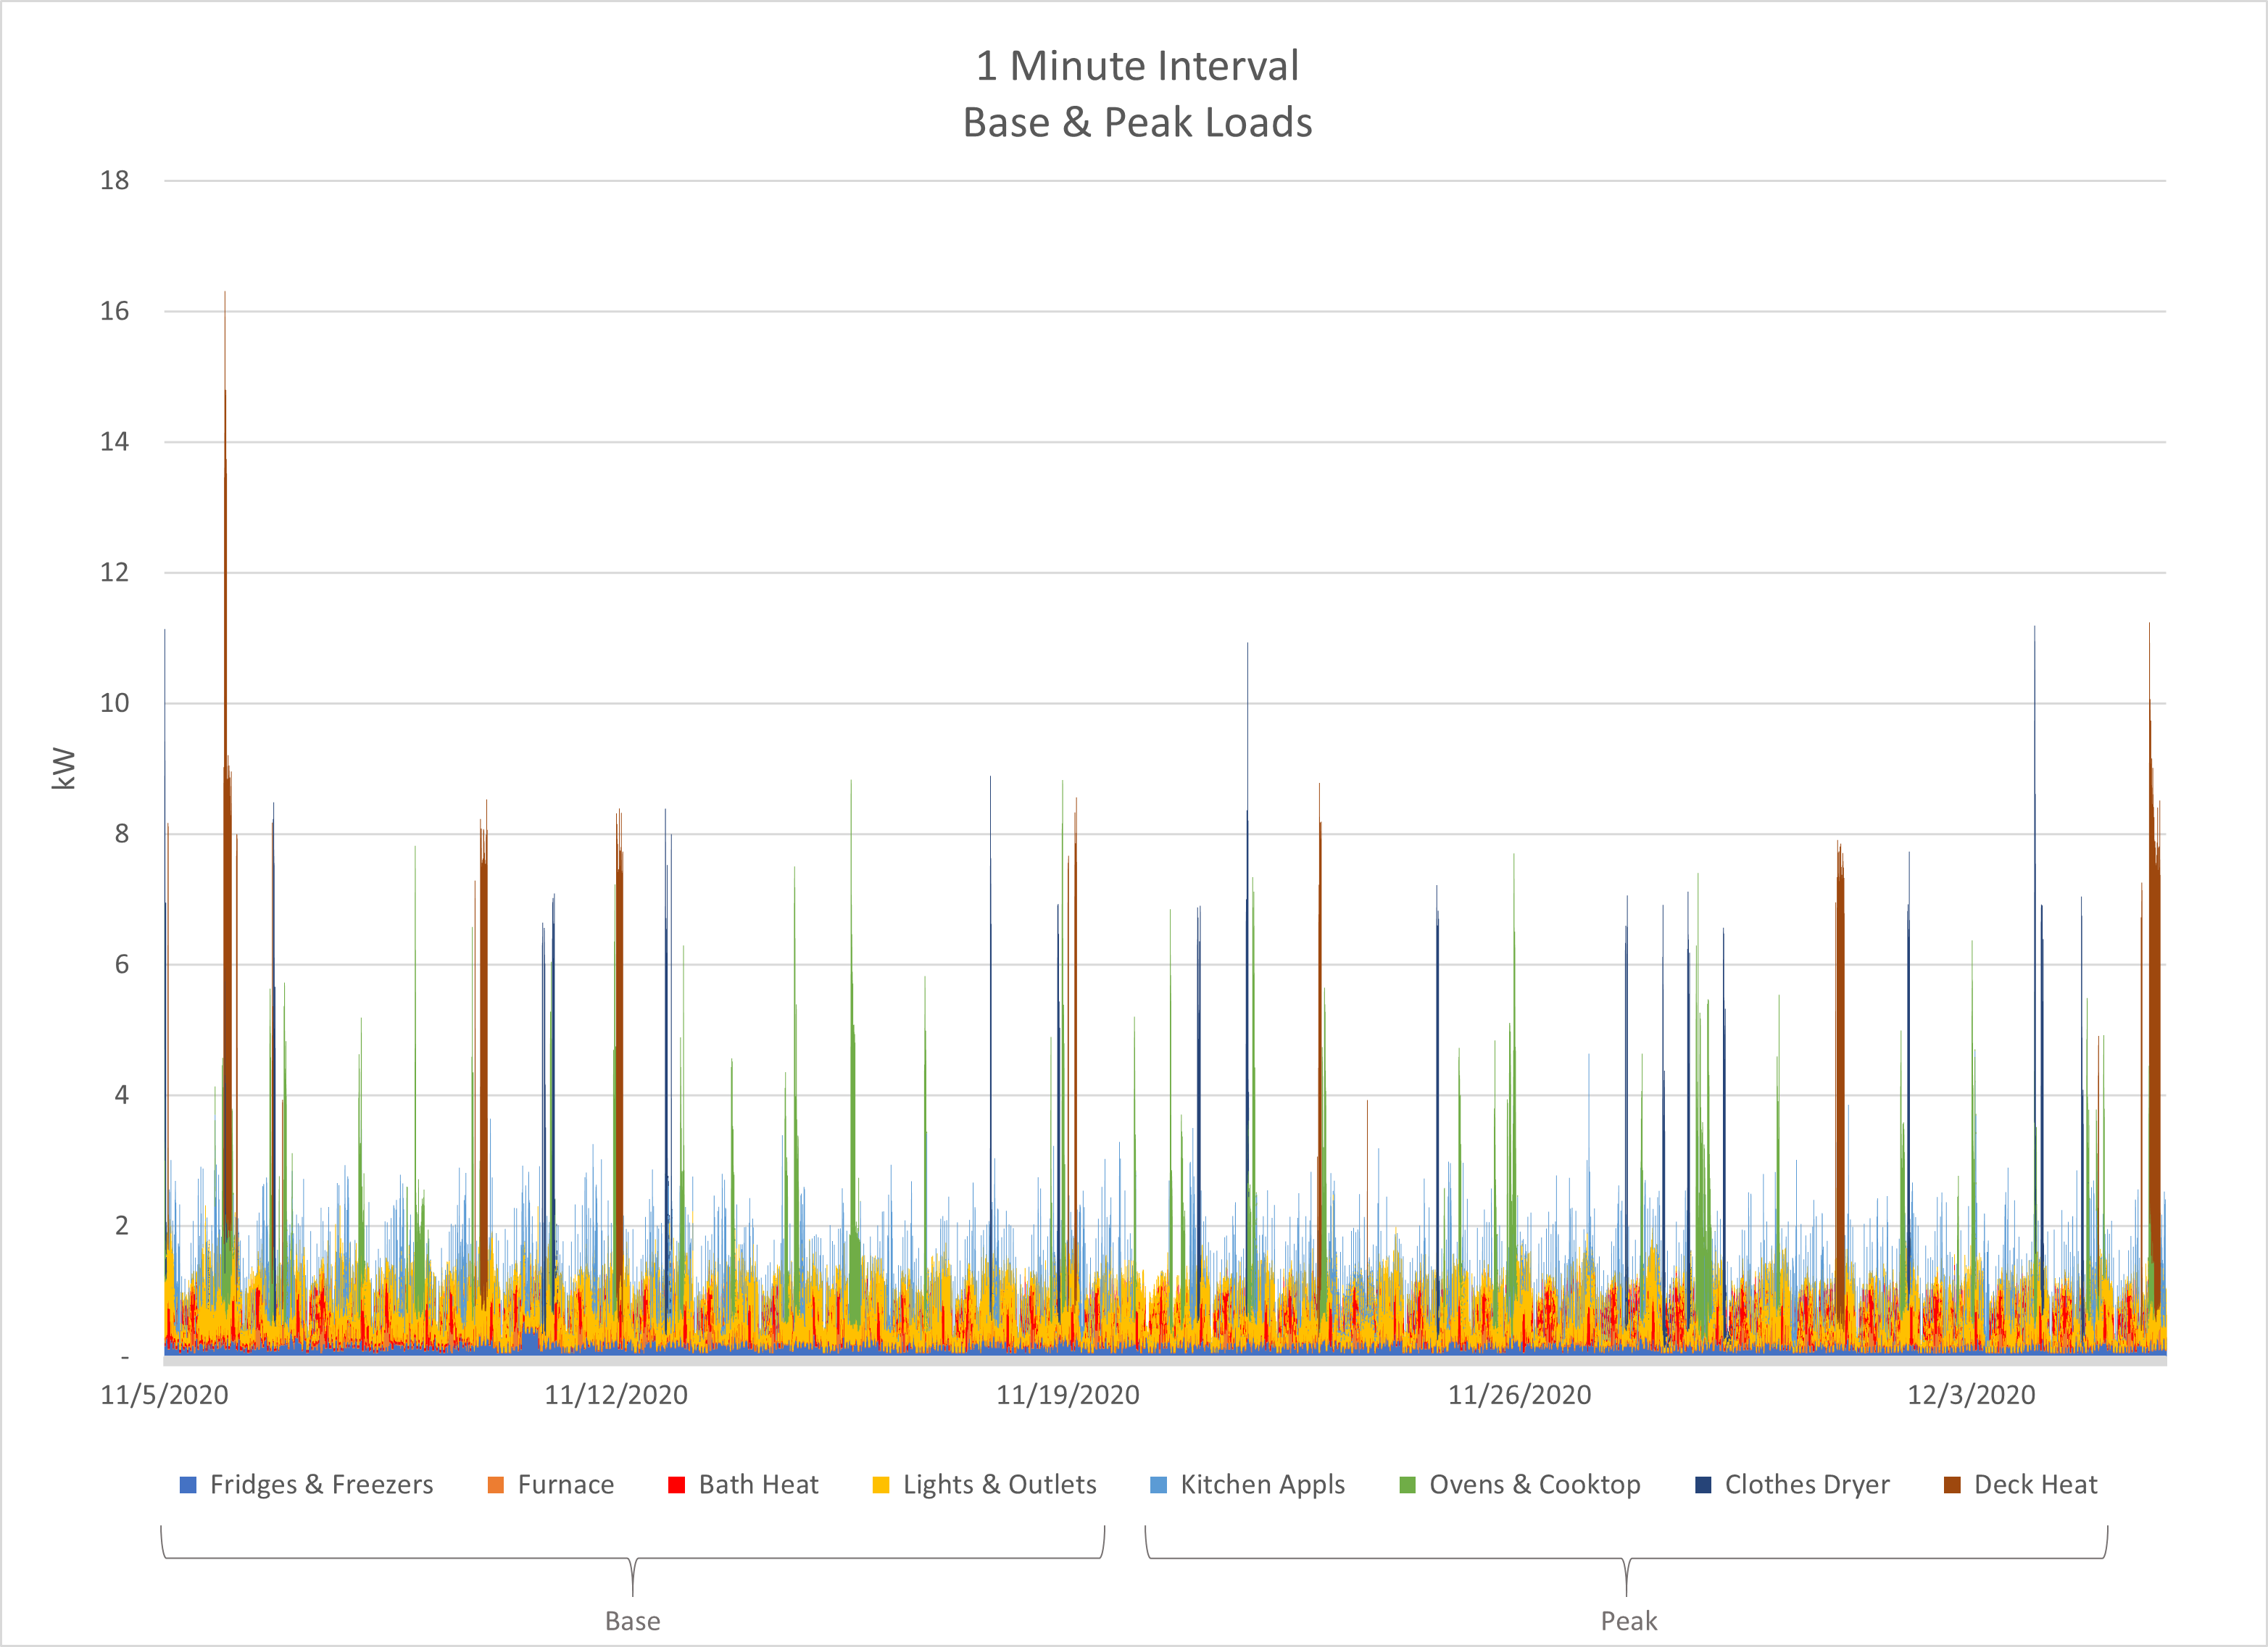
All Loads 1 Minute – Usage for each minute of the month, grouped into categories. The “base” loads always use power. The “peak” loads are infrequent but significant usage.
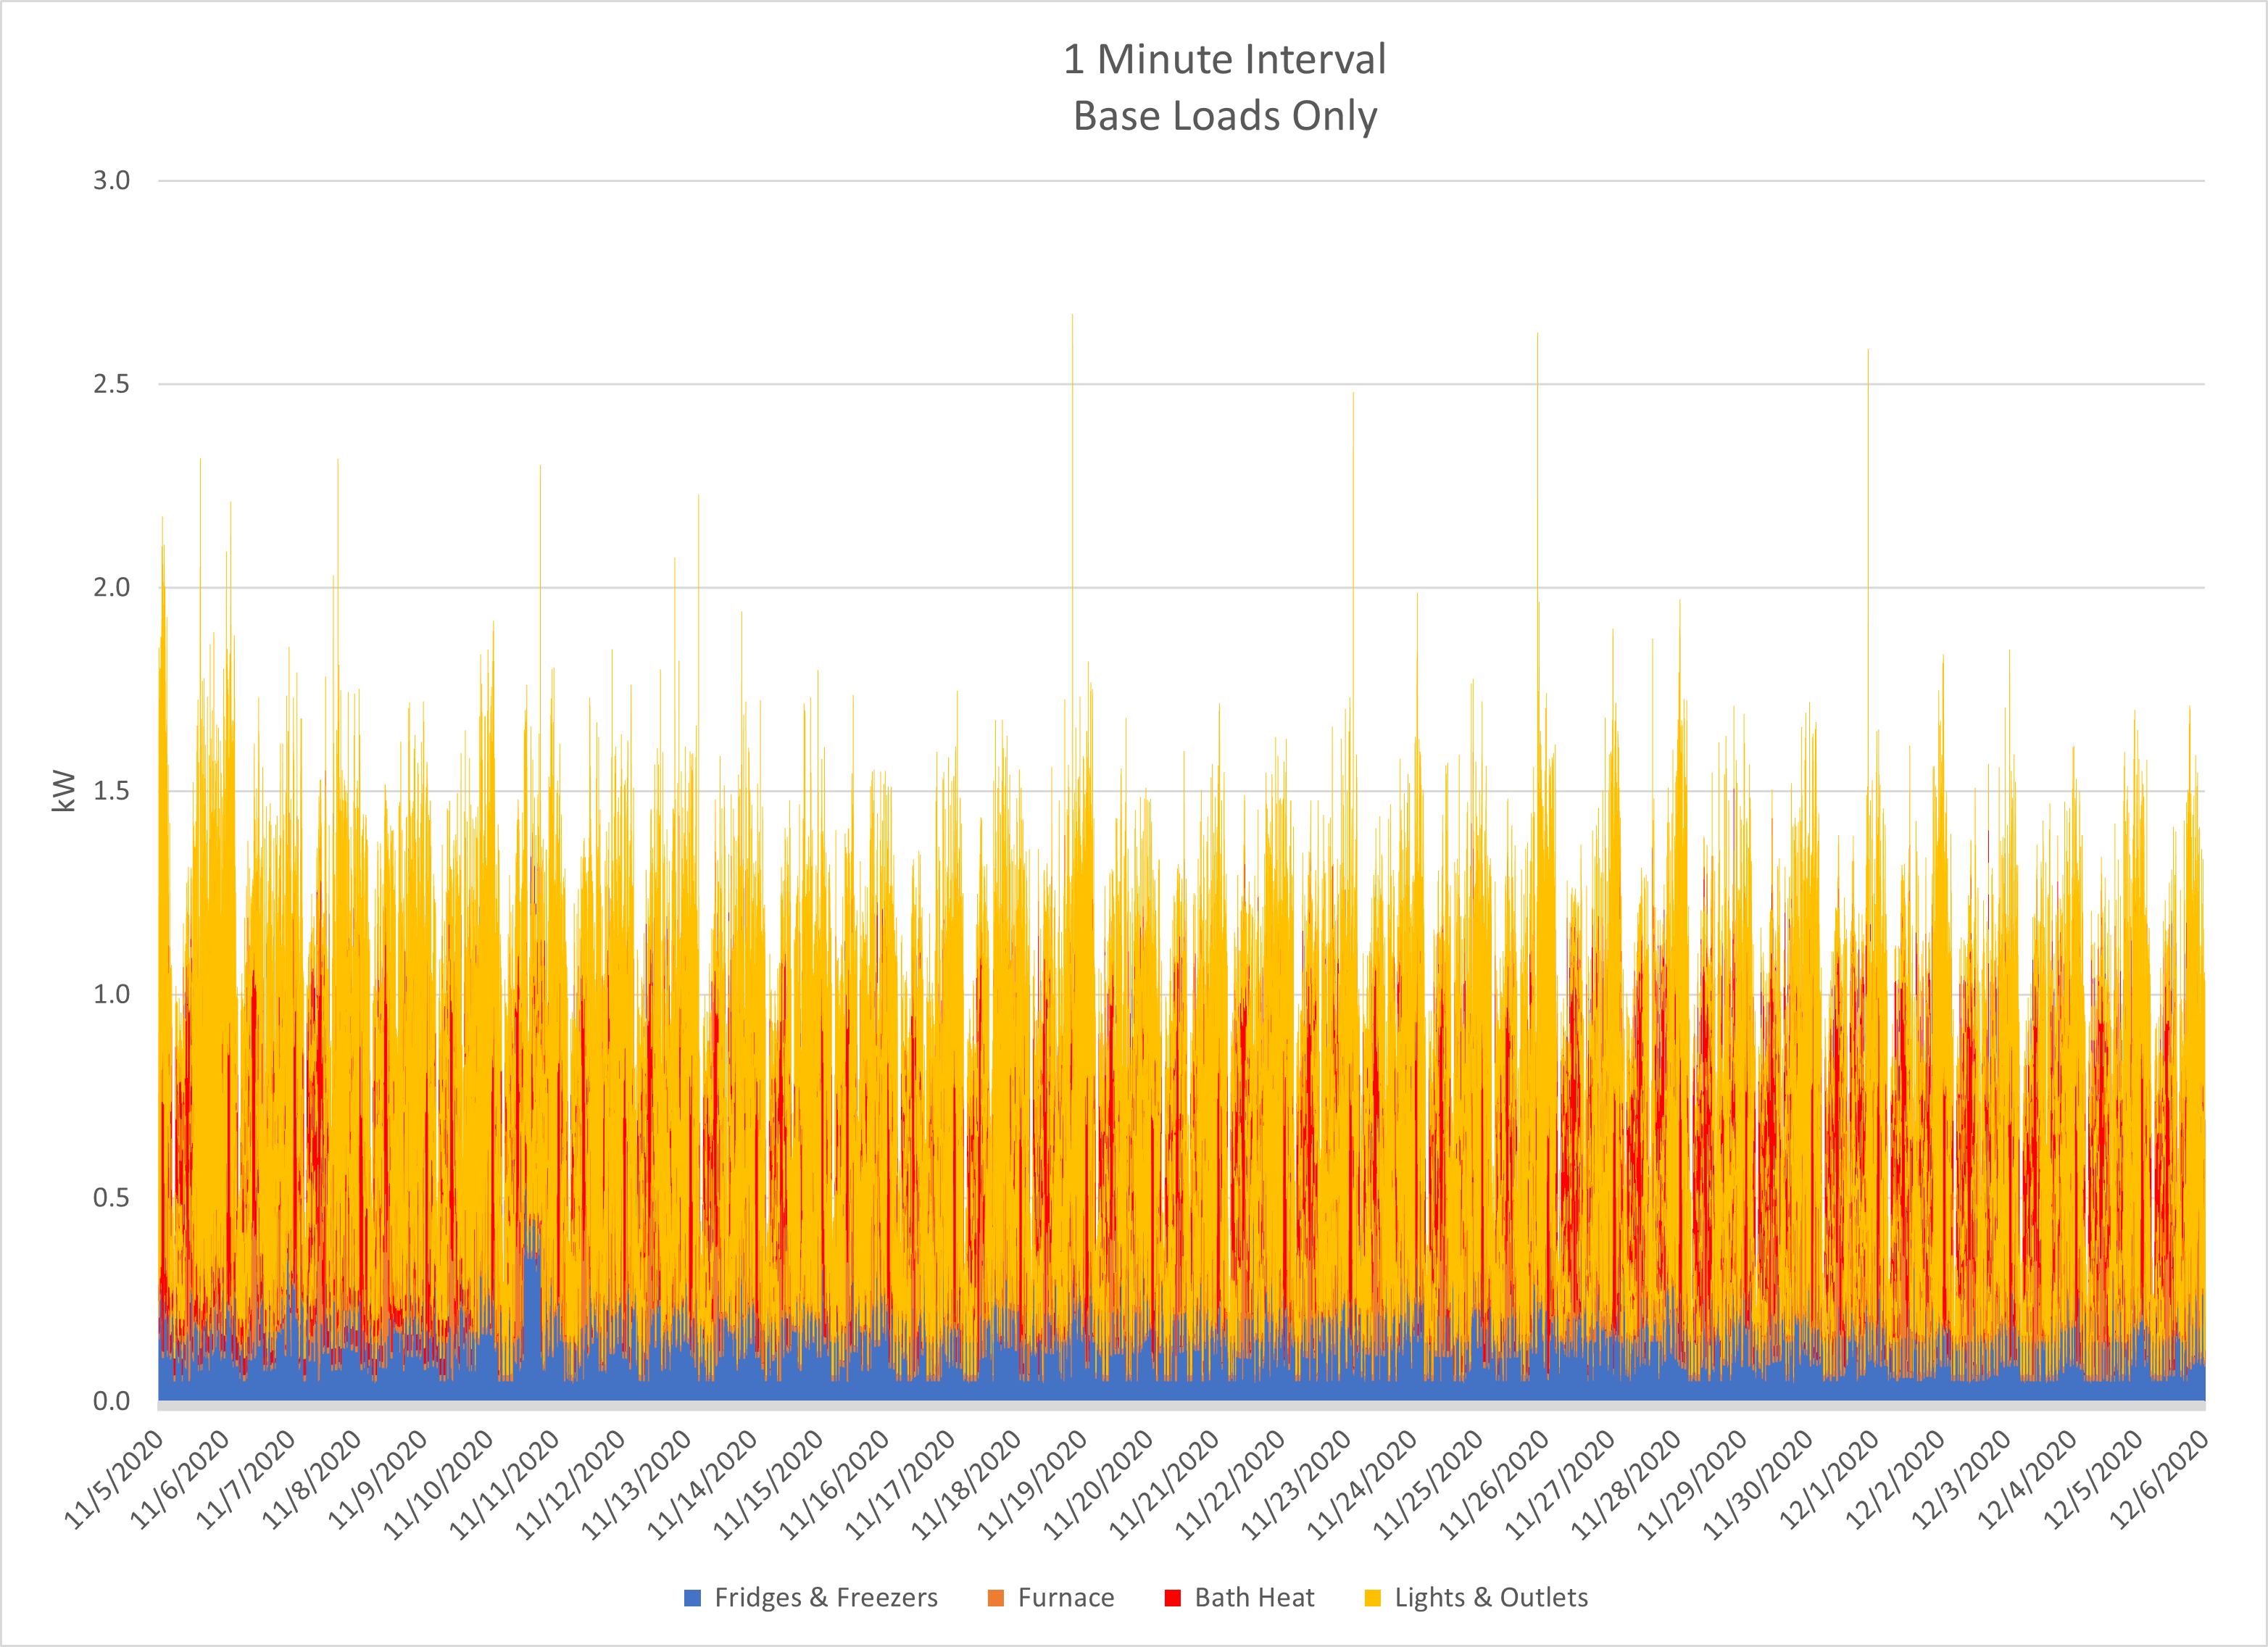
Base Loads 1 Minute – In total, the “base” categories average less than 1 kW. Over the month “base” exceeds 2 kW only 0.1% of the time.
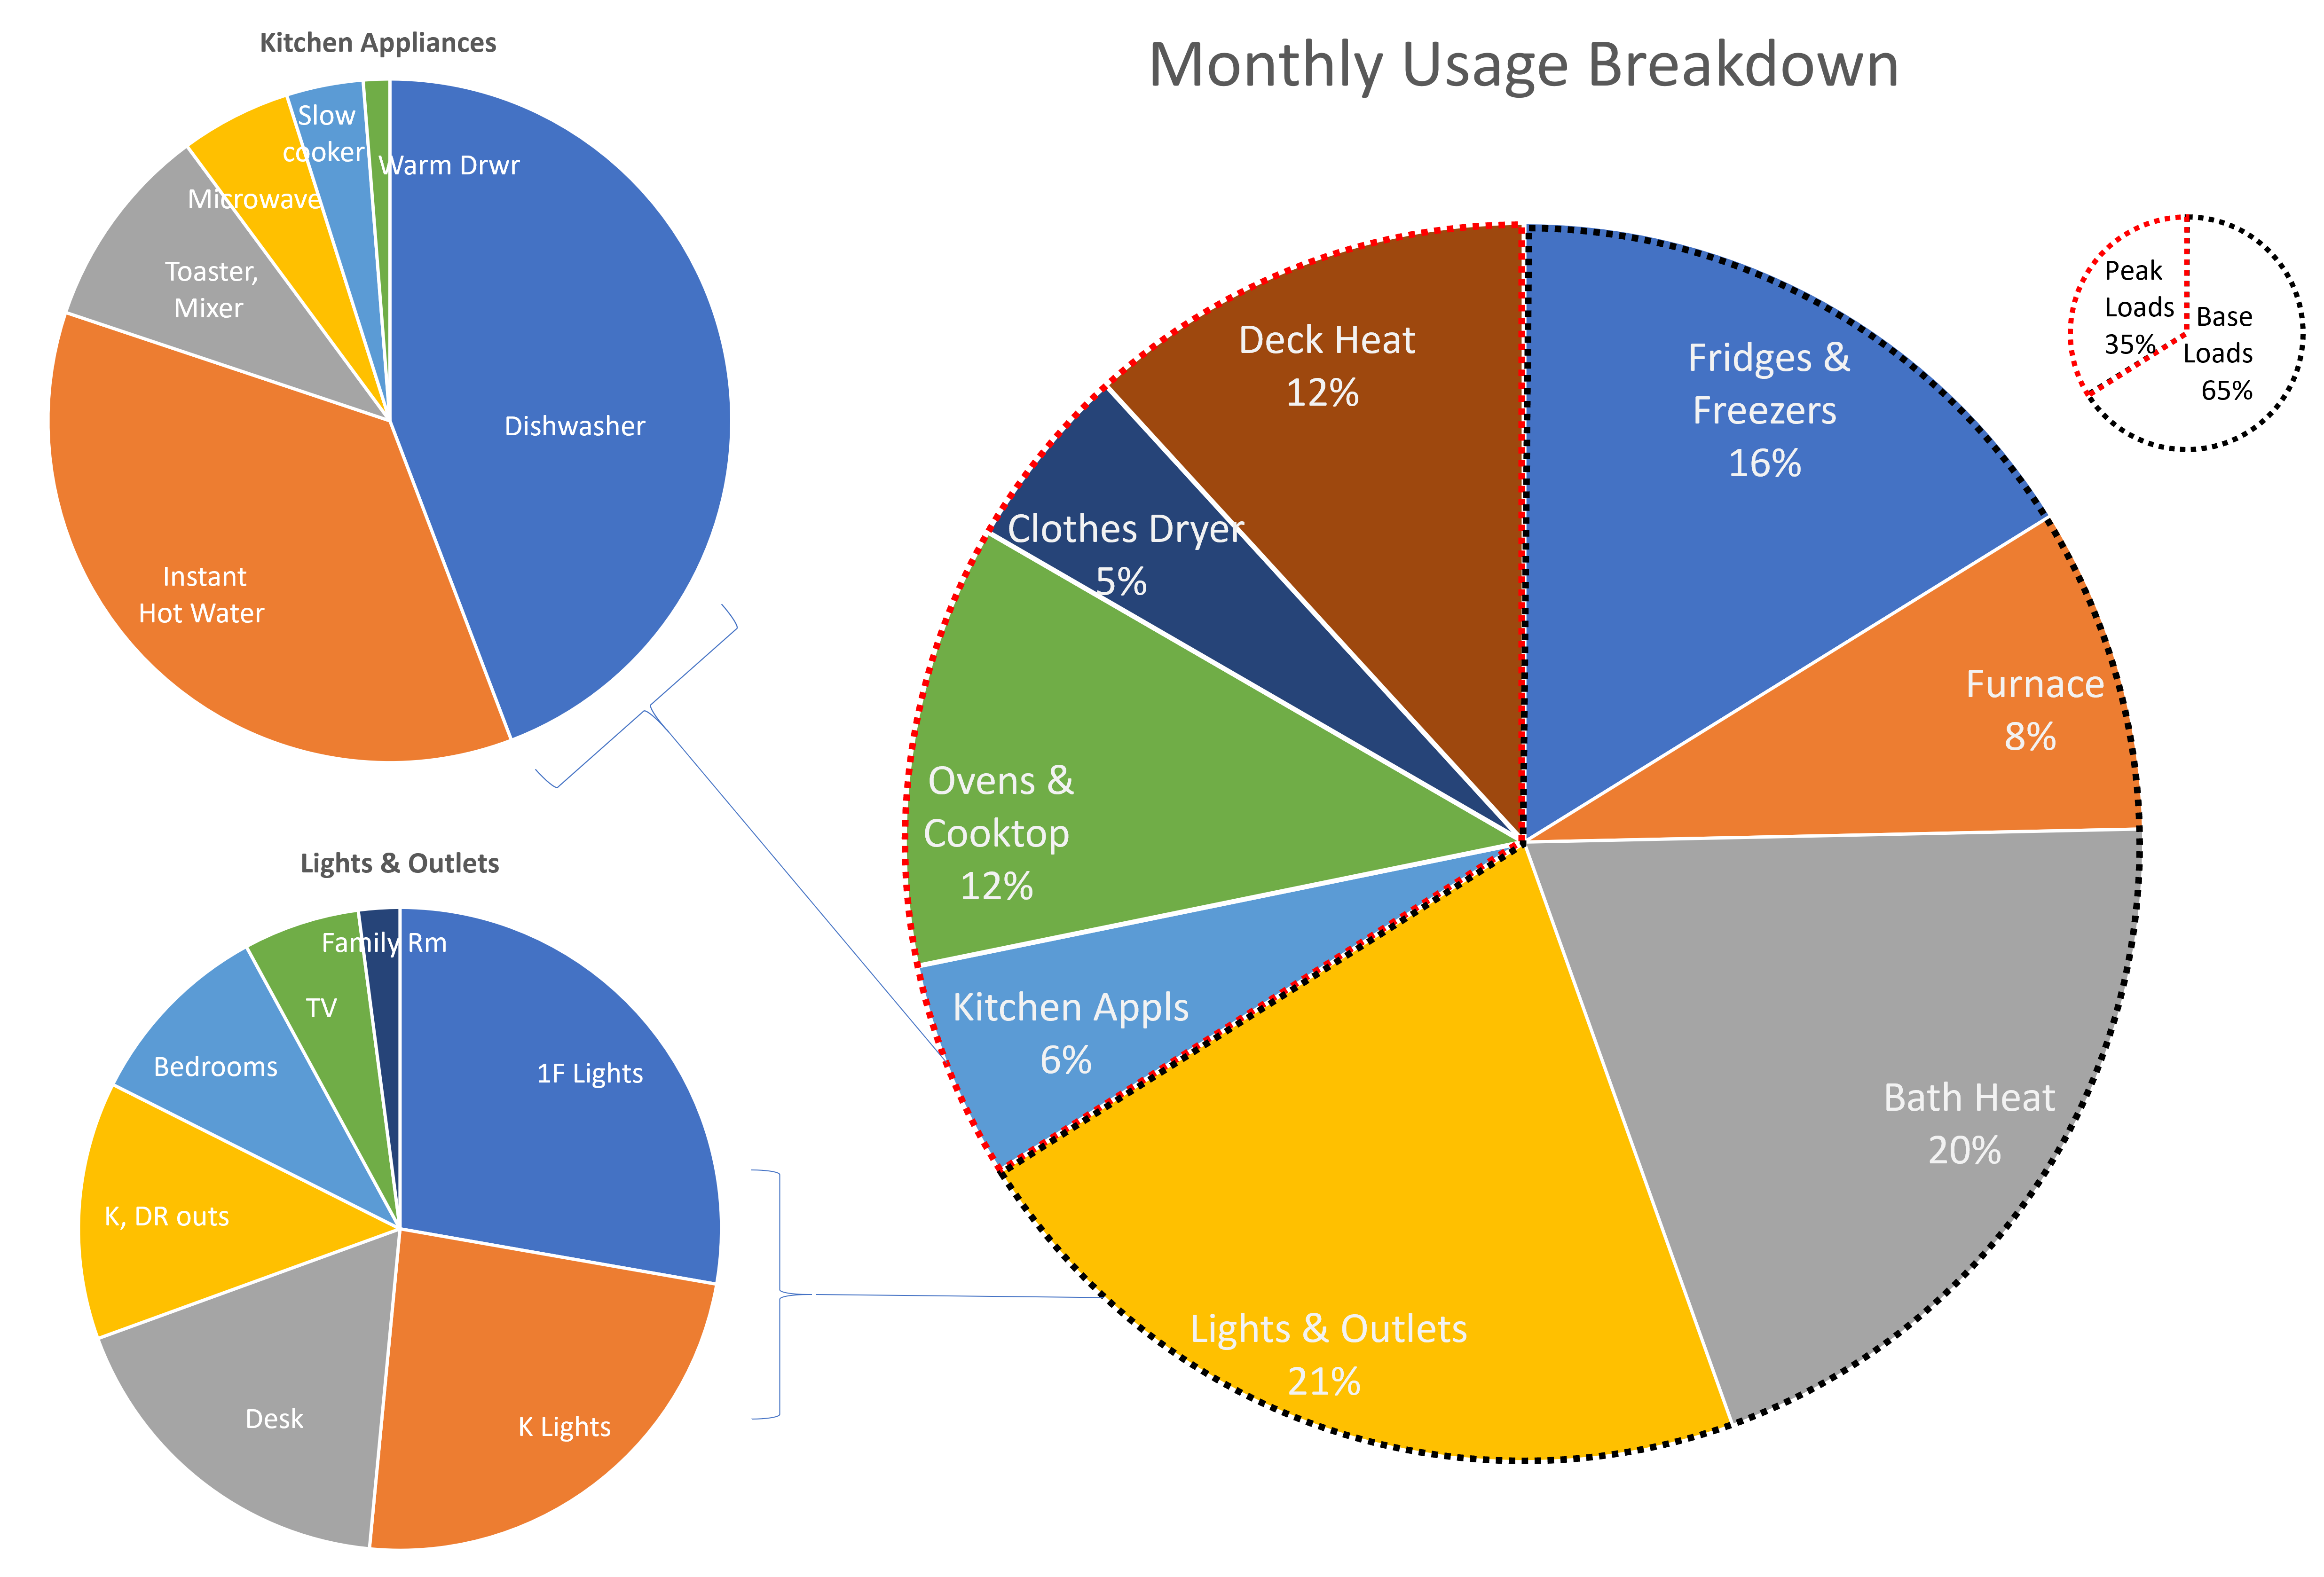
Monthly Usage Breakdown – Low and consistent usage of “base” loads accounts for 65% of monthly kWh. I would expect that during non-pandemic periods the clothes dryer would be used more while cooking and lighting would be used less.
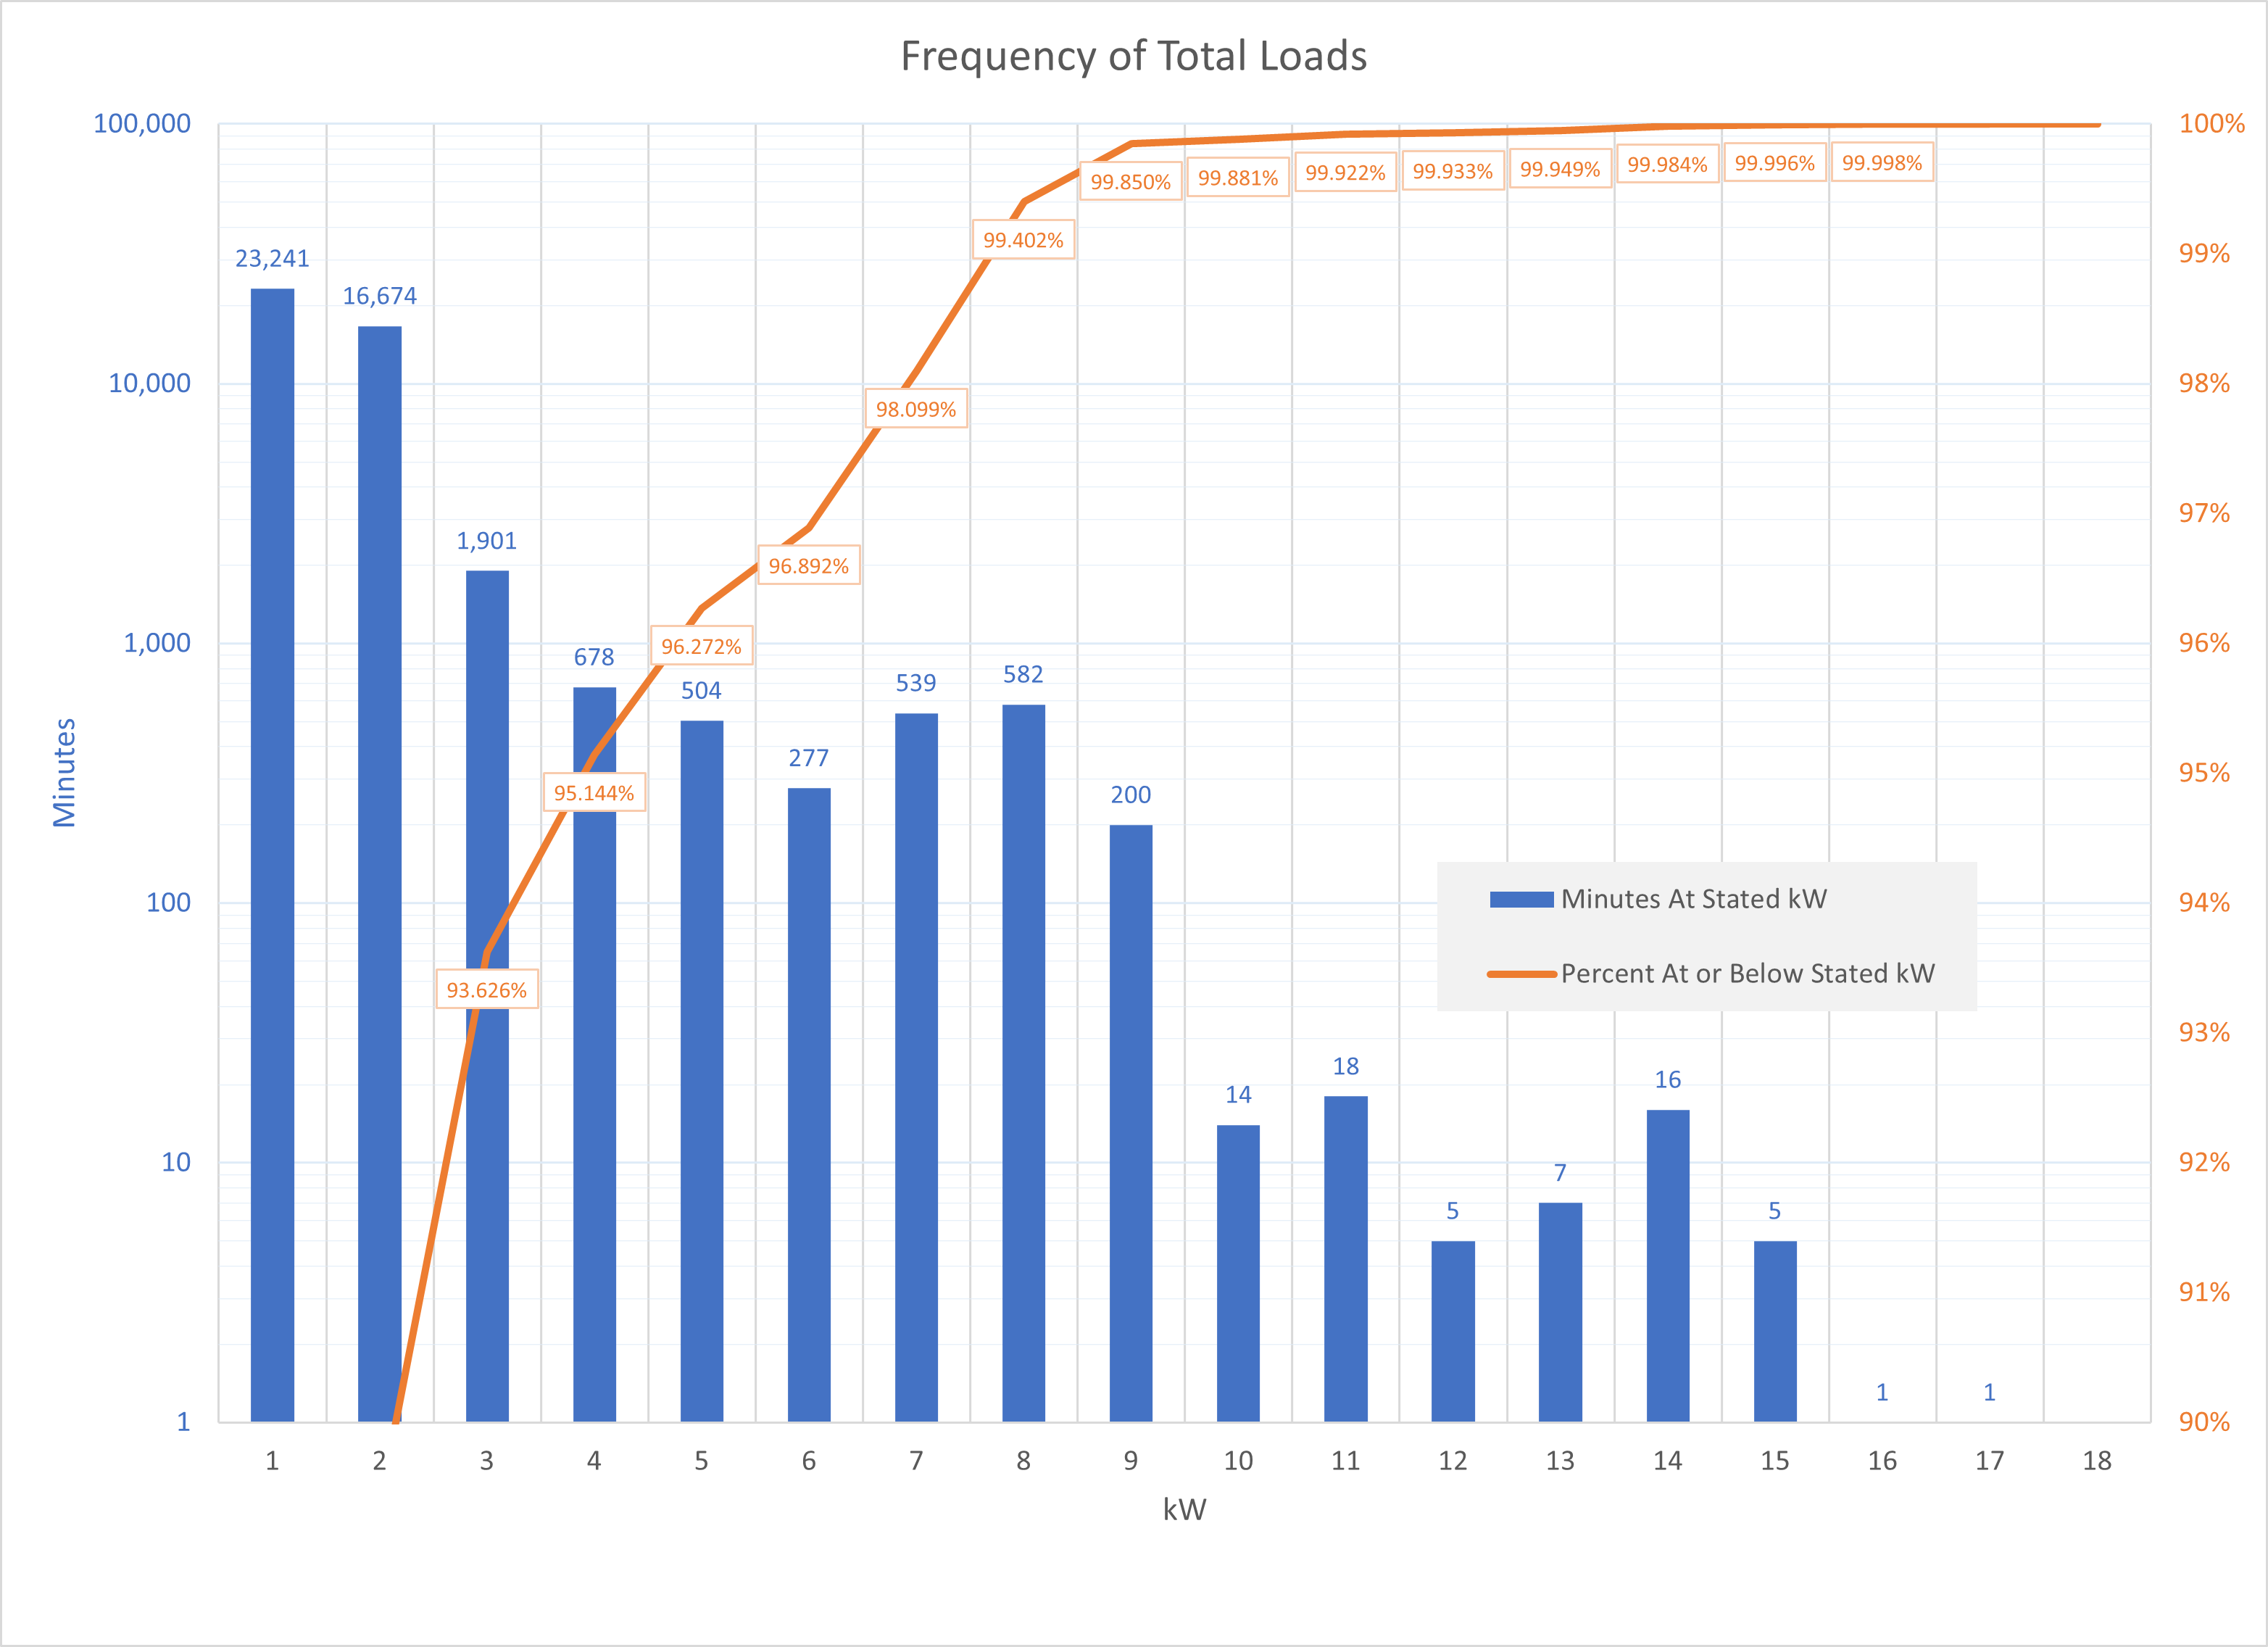
Frequency of Total Loads – Consistent with “base” loads usage, the most frequent total consumption is 1 or 2 kW. Considering needed capacity—from utility or home generation—usage exceeded 8 kW during 0.6% of the sampled month and 16 kW only 1 time.
The results of this work were (for me) three-fold:
- Confidence in choosing an appropriately-sized backup generator
- A better understanding of peak and total electrical usage in my household
- A baseline from which efforts to modify electrical usage can be measured
I would gladly pay a small subscription fee to have this type of analysis and reporting available in app, via browser, or sent to me regularly. I have a “smart” water valve (that monitors usage and detects leaks) from which I get a monthly report about my usage that similarly helps me understand usage and notice changes.
-
dgreenb
MemberHi John, this is awesome. Any chance you can share your Excel for the rest of us who are not such a wizard? I know there will have to be some massaging as our columns most likely won’t line up perfect, but this is an amazing set of graphs!
-
Member
I am happy to share the Excel workbook I used to create the graphs. It is large because it contains all the data and charts. This is a public link so you should not need an account or anything else to access https://1drv.ms/x/s!As47IUP__v_UoOJqJCHwnov74b-GIg?e=bf64AA. The link will most likely open the browser-based version of Excel. The file is view-only so if you wish to edit, you will need to make your own copy. I suspect it will work better to open in the desktop Excel application.
My intent is to show that with some analysis there are valuable insights in the data and that Emporia could offer a service to automate and deliver such reports. I do not think many people will want to spend the time to collect, manipulate, and analyze the data themselves.
In case it helps, I will explain a bit more what I did:
- download and import into Excel CSVs from Emporia
- label and combine individual circuit data into more meaningful groups (4 groups comprise “base” and 4 more for “peak”)
- use various charting methods and data analysis formulas to summarize and display
The key insight Emporia could deliver–peak vs. base categorization and usage thereof–is an attribute of the usage itself and could be identified algorithmically (and so does not require customer input).
-
Greg
MemberAny chance you could convert to something to that open office will open,,,.. Thanks HAving trouble,, looks great
-
-
AuthorPosts
- You must be logged in to reply to this topic.