Emporia Energy Community › Support Center › Emporia App › What kind of device displays this behavior – 0W or 5W for one second at a time?
- This topic has 3 replies, 4 voices, and was last updated 3 years, 2 months ago by
jj613.
-
AuthorPosts
-
-
jj613
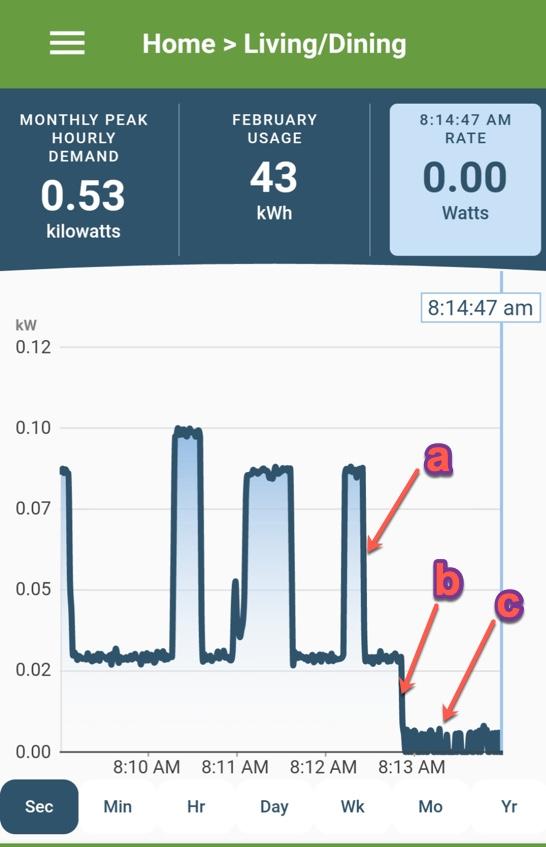
MemberSee the pic below. This circuit is all the lights and sockets in my living/dining room. At “A” I turn off the lights. At “B” I unplug the power bar for the TV/Roku/amplifier etc … all the electronics. What’s left, at “C”, there is clearly still something plugged in but looking at the Second data on the app it’s odd. It goes up and down at even, regular, 1-second intervals between 0W (zero exactly) and 5 or 6 Watts. It’s hard to see in this picture but the pattern is almost a square wave with period of 2 seconds. I don’t know what is still plugged in to this circuit, but whatever it is, it’s hard to think of anything that would use 5 watts one second and zero the next, again and again in rhythm. Is this some side effect of the way the Vue works? The combination of 1-second granularity and the sensitivity at less than .05A? What would cause this behavior?
-
waterboyz
MemberI thought I read in here somewhere that the one-second interval is not really a “one-second” interval but some kind of average over 5 seconds. But then again, it could be some residual leftover. I’m no specialist in this area of life. You have great graphing skills by the way.
-
scrambler
MemberThis may just be some noise on the CT.
5W is around their precision limit
-
Emporia Support
Emporia Staff@jj613 I believe what you are seeing is noise on the sensor in question. I have forwarded this to the engineering team to look at well and if they come back with a different opinion will let you know.
Our sensors and devices have physical limitations. Each 200A sensor is accurate with high resolution between 0.04A – 250A (5W – 30kW) And each 50A sensor is accurate with high resolution between 0.04A – 75A (5W – 9000W). When you go below those ranges, the sensors will report 0W. When you exceed those ranges the sensors will reach saturation and not report anything higher. Going above the sensors range does not cause any risk of damage to the Vue or the sensors.
-
Member
Thank you Emporia Support. I’m interested to know what Engineering says. I want to emphasize that when I’m actively watching the noise it oscillates with a period of *1 second*. You can see a point “c” in my graph that it looks like a square wave, and you can’t see it but the peaks and troughs are one second each. The only way I could demonstrate this would be with 1-second data download or if I could control the X axis of your graph, or maybe if I took a movie of my phone while running the app. IE there is no easy way for me to SHOW YOU what I’m writing: It doesn’t look like noise, it’s a reliable, rhythmic, oscillation between 0A and .05A every second. Say I’m at, say, .04A, I could understand you saying it’s below the sensor resolution, so I would expect to see zero. Or perhaps something random. But this 1-second-on 1-second-off pattern is really odd.
-
-
AuthorPosts
- You must be logged in to reply to this topic.