Forum Replies Created
-
AuthorPosts
-
November 27, 2024 at 2:17 am in reply to: Pulling Energy monitor data via json through API #11574 Report Abuse
flyoffacliff
MemberHi! I just left a comment on your GitHub discussion page. Trying to better understand your project.
flyoffacliff
MemberI’m also disappointed by this change. I’m downgrading to the previous version of the app for now. Hopefully it doesn’t break soon.
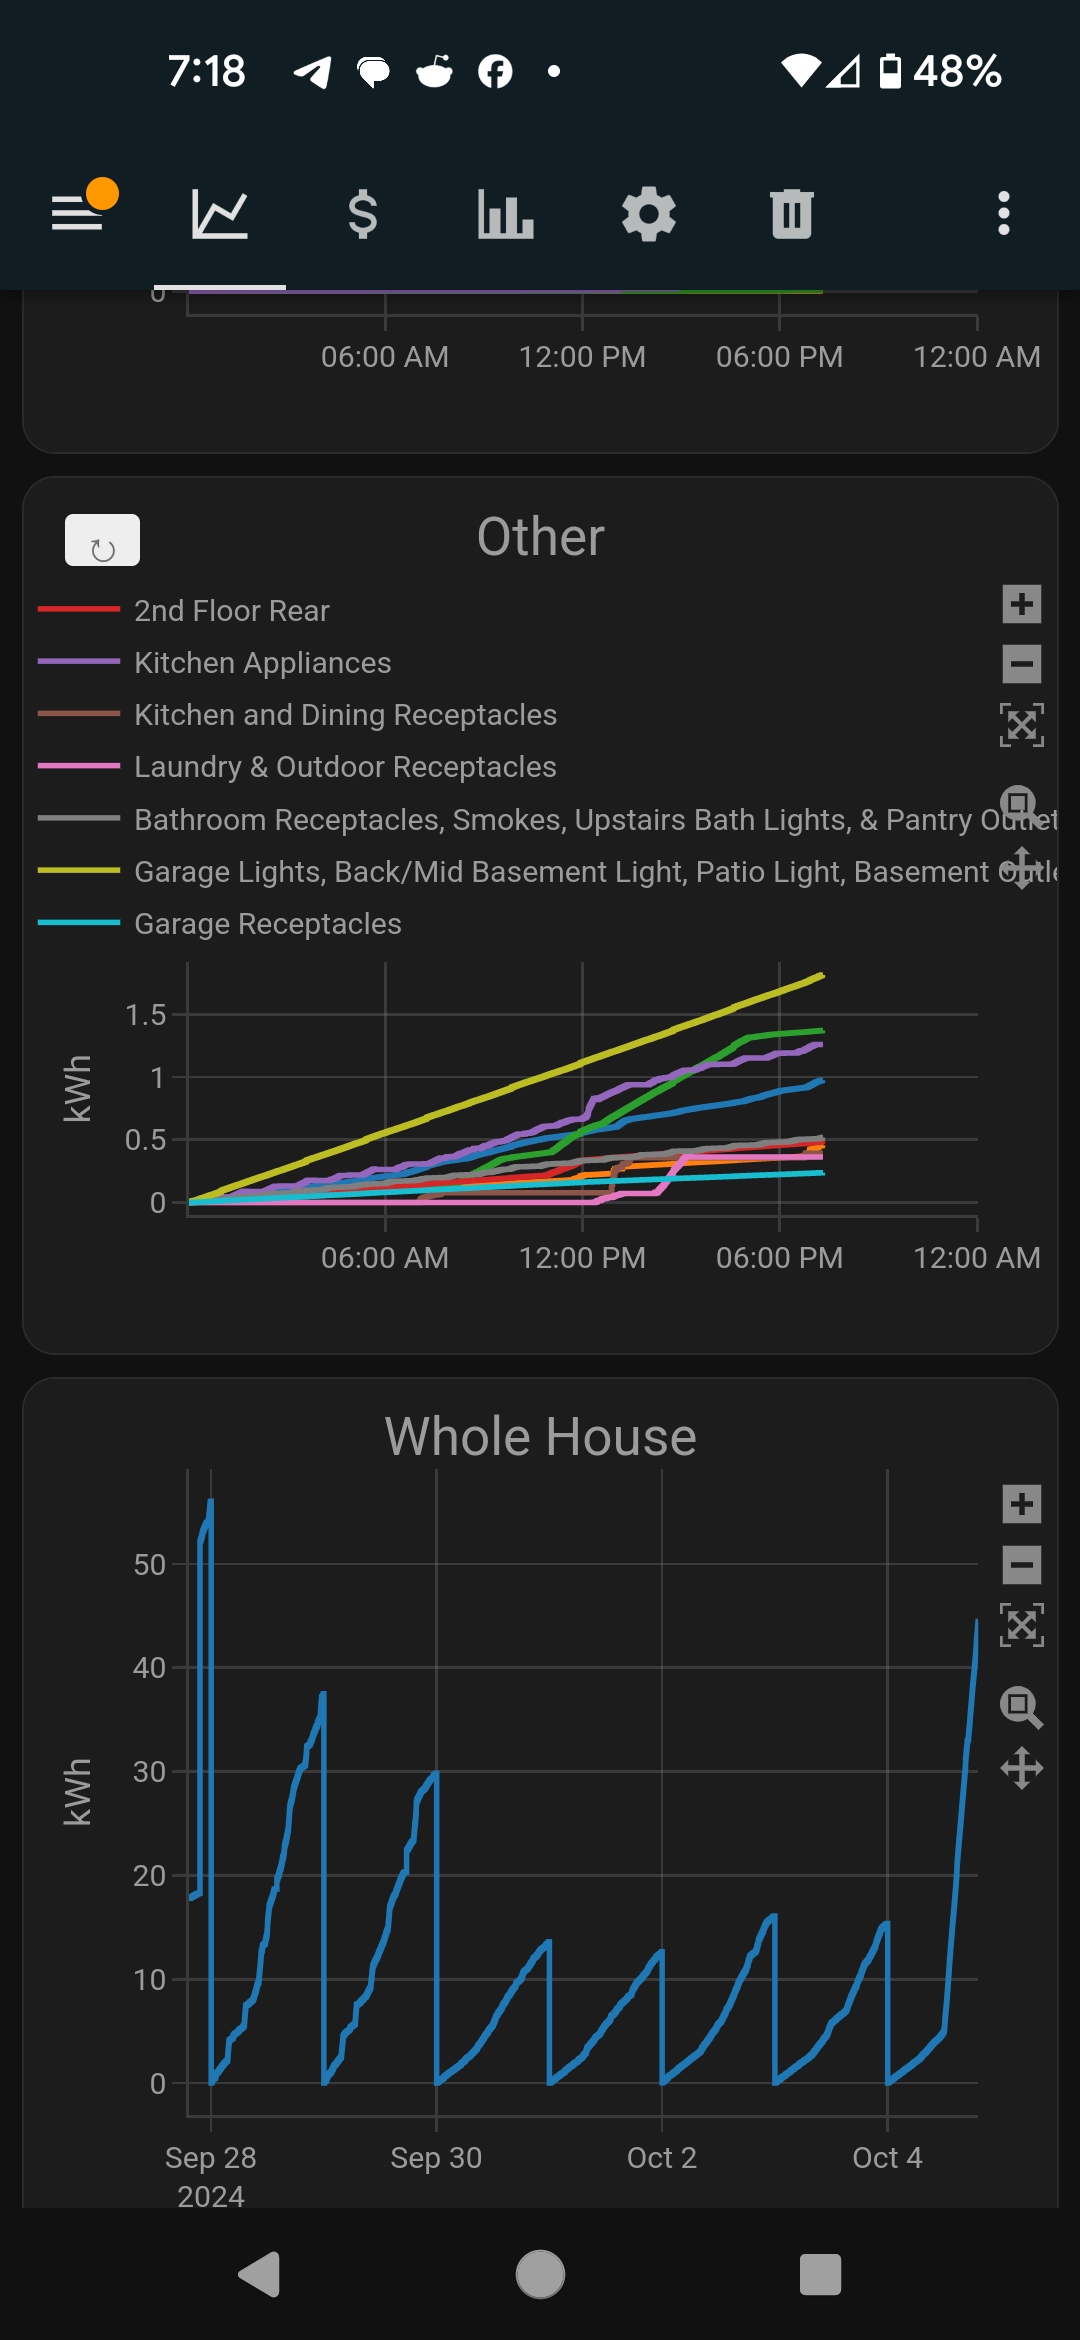
Perhaps you could pass this off to your Dev team for some inspiration. These are custom graphs I developed using your API. I think it provides a better representation of all the circuits together, showing how they change throughout the day and reset at midnight. I can drag to adjust the time range and tap each circuit to add or remove from the graph. The graphing library is called Plotly.
 July 30, 2024 at 11:47 pm in reply to: Demand for Commercial 480V Energy Monitoring for >200A and 5GHz WiFi #11162 Report Abuse
flyoffacliff
MemberThat would be nice, just like I would like to see a model with more than 16 circuits supported.
But it’s just not the target market for Emporia. They mostly make products for residential applications.
Shouldn’t be too hard to build something custom if you can source the proper CTs I would think.
flyoffacliff
MemberWow that’s one of the neatest electrical installations I’ve ever seen! Nice work!
flyoffacliff
MemberYes there are a few others similar to the Vue. They are a little bit more expensive.
Probably would be frowned upon for me to post links to a competitor’s product here. But if you search the home assistant and home automation subreddits there’s a few good posts there about it.
flyoffacliff
MemberThe link you posted is broken. My Vue 2 does not track data if the connection goes down it seems. The app just shows a straight line. Maybe if you restart the app after the connection comes back it shows up?
flyoffacliff
MemberHi, any chance I could get an official update on some of these points please?
flyoffacliff
MemberThanks for the update! Happy to see this product being worked on more recently.
flyoffacliff
MemberThanks for passing this on. Just wanted to provide an update to each question / issue separately.
1. This was renamed to “Voltage_A” (and B) now, so it’s less confusing, but it’s still inconsistent in that there is an underscore between the word voltage and the letter. The other categories like “Total Usage” have a space between words. This is just a minor nitpick.
2. The issue of it displaying the misleading number on the list view is fixed, but when you click it, it takes you to the graph view which still has the incorrect data. This is because A and B are combined on the graph view but separated in the list view.
In other words, after I click “Voltage_B 126” in the list view, it opens the graph view showing 252. Perhaps the Vue 3 won’t have this issue because it monitors voltage on each leg separately, but it would be nice if the app displayed it clearly for both generations.
3. This issue was completely fixed, thank you!
4. The update they did here sort of went the other direction. Instead of making both views consistent by ADDING the decimal places to the GRAPH view, they REMOVED the decimal places from the LIST view. I can tell by the tiny (several pixel) changes in the height of the bars that the voltages changing but doesn’t show up in the whole number because it’s rounded.
5. Ok thanks, it would be great if this was added to the CSV data as well.
6. Something else that would be great would be to adjust the axis on the graph view for voltage so it’s easier the see small changing since each bar is always about the same height.
If you could pass these updates of # 1, 2, 4, and 6 to the developers that would be great. I can provide some screenshots if that would help. Please let me know. 🙂 Thanks again!
flyoffacliff
MemberYour link for Vue 2 does not work. It asks me to sign in with a Zendesk account. I searched and couldn’t find it either.
flyoffacliff
MemberI would just assume it’s not coming. They’ve been saying this feature and others are in the works for years now. They don’t give time estimates for anything.
flyoffacliff
MemberBeing able to generate reports would be nice. My electric utility already does this for me and emails them. I’m sure we’ll never see this feature added though.
flyoffacliff
Memberflyoffacliff
MemberI don’t really understand what you mean in this comment because there already is an open API used by PyEmVue, and it’s been around for years
flyoffacliff
MemberThe API is a bit of a mystery it seems. Emporia posted on these forums even fairly recently saying that no API exists, but it definitely does and even one of their own help articles lists some things that use it, so idk.
No I can’t recall ever seeing it down until now, and I use it a couple times a week for the past 8 months.
-
AuthorPosts
