Forum Replies Created
-
AuthorPosts
-
February 26, 2021 at 1:50 am in reply to: Emporia limiting minute data to 3 day starting march 1st #7035 Report Abuse
scrambler
MemberGlad to hear that, and if this is the case, marketing wise, you would be better off limiting the minute data when that plan is actually available.
People are more likely to subscribe when they feel the pain. By removing the ability now when there is no alternative, they will be forced to get use to doing without the data, and are less likely to subscribe when an alternative actually becomes available 🙂
If not, please consider restricting to 8 days until the subscription is available (instead of 3), so we can do a weekly download. Every two days is just not practical.
Again, if people cannot get the data in a practical way for a long time, they will have to get use to not using it and many will be less likely to subscribe…
My 2 cents
-
This reply was modified 4 years, 3 months ago by
scrambler.
February 17, 2021 at 2:13 am in reply to: What kind of device displays this behavior – 0W or 5W for one second at a time? #6973 Report Abusescrambler
MemberThis may just be some noise on the CT.
5W is around their precision limit
February 11, 2021 at 5:55 pm in reply to: Last post time incorrect in parent folder #6904 Report Abusescrambler
MemberI forgot to add that last post and not last thread (if this is what is being shown) is really what is useful.
Ideally, if you could have a What’s new page showing all the new post since the last visit, that would be ideal for people who want to quickly check the forum for new discussion or answers.
This help engage people more, as they can quickly see what is going on and be tempted to participate.
If one has to go drill down into every sub forum to see if there are new elements, they are likely to skip.-
This reply was modified 4 years, 3 months ago by
scrambler.
scrambler
MemberAs far as I know you can set the Multiplier to whatever you like.
From what I read, this was actually used for Gen1 that used a fixed 120V reference to compute power, allowing people to correct the power calculation to account for a different value than 120V.
February 8, 2021 at 9:21 pm in reply to: Glitch / error in Minutes data reporting #6868 Report Abusescrambler
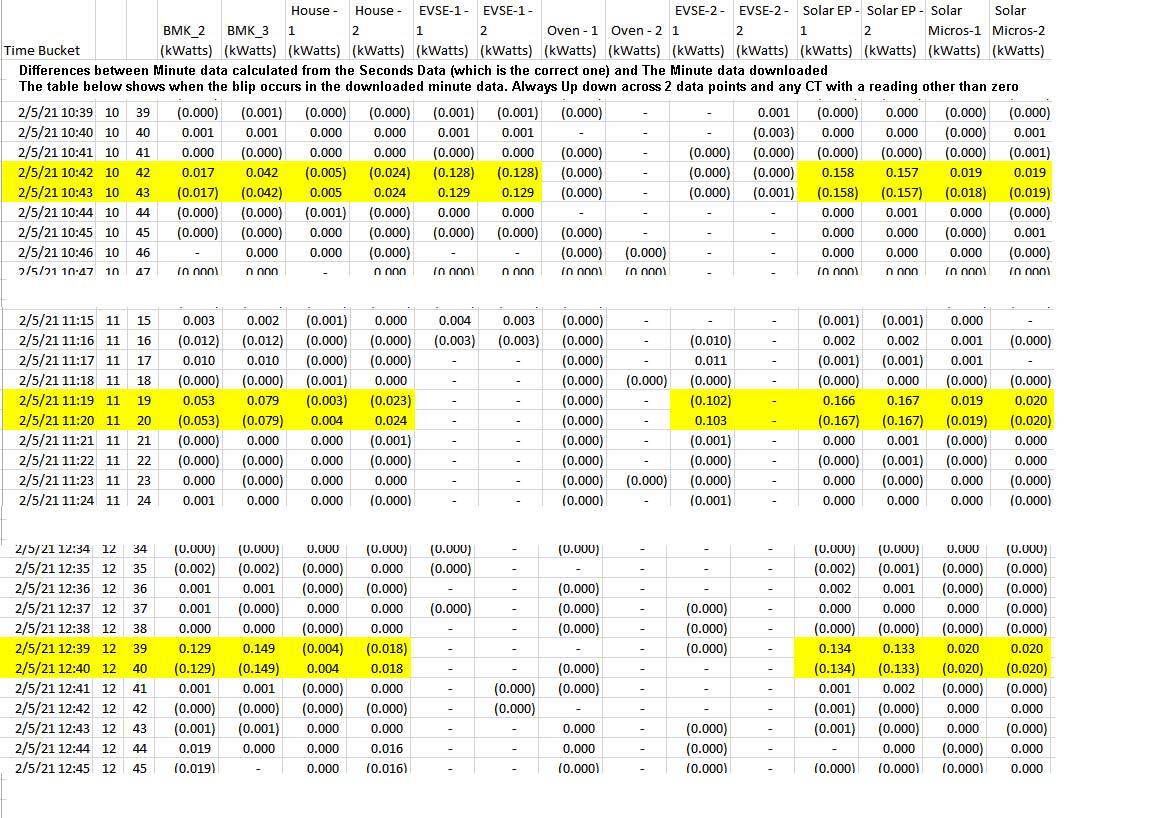
MemberI created the same difference table with the Feb 5th seconds data.
I calculated the minute data from the seconds data, and made the difference with the downloaded minute data. The blips illustrated in the first post appear across all CTs that have a non zero reading.
 February 8, 2021 at 7:30 pm in reply to: Glitch / error in Minutes data reporting #6864 Report Abuse
scrambler
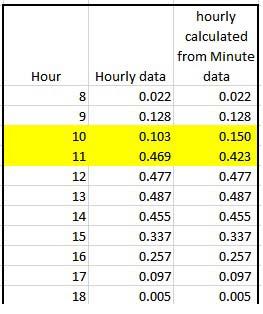
MemberTo detect all discrepancies between the hourly report and the minute report, I recalculated all the hourly data from the minute data in excel and made a difference table between the recalculated hourly data and the downloaded hourly data, and the error in the downloaded hourly data appear clearly, always over two consecutive numbers, with equal deviation up and down.
This is the same phenomenon that was initially detected and reported in this thread, between the seconds data and the minute data.
So I assume all starts with the seconds data that is correct, then when minutes data is calculated that error occurs occasionally, and then when the Hourly data is calculated, the same happens (I have not check daily data yet)
 February 8, 2021 at 6:54 pm in reply to: Glitch / error in Minutes data reporting #6863 Report Abuse
scrambler
MemberFYI,
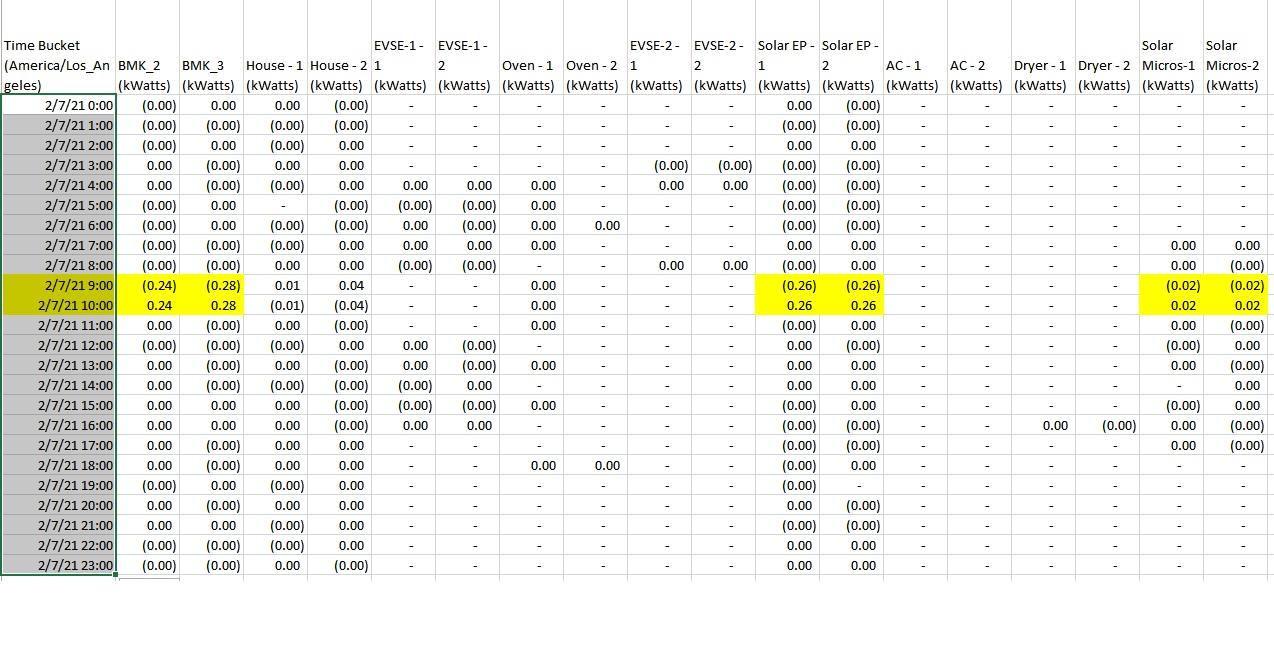
It seems the same issue is happening between Hours interval reporting and Minute interval reporting.
Sometimes the hour data will deviate from the minute data in the same way as described above. One value will be higher than it should the next below what it should, then back to normal.
 February 7, 2021 at 11:39 pm in reply to: Functionalities and App suggestions following recent installation #6856 Report Abuse
scrambler
MemberOne more suggestion to the above:
Unless I missed a functionality, it can be very hard to inspect a past event using the app graph page. Problem being there is no way to directly go to a specific date and time except by scrolling, which can take forever depending how far back you are trying to goo in any specific time view.
I have already suggested to give us a calendar tool to select a specific day to go to (and auto scale the view to that day). I also suggested to allow us to scale axis with pinch to zoom.
In addition to the above, the functionality below would go a long way to make that process easier.When switching between time Views (sec, min, hour day…), maintain the time the cursor is currently on to prevent having to scroll forever.
For example, let us say you want to check the minute graph of a load 5 days before the current day/time. Right now you have to scroll the whole 5 days in the minute view to do that.
Instead we could use the day view to scroll to that day, then switch to minute view and still be on that day.Same if you wish to check the second view of a load a long time before current time, you could approach it using the hour view, then switch back to the second view when you are on the hour in question.
Thank you for listening 🙂
-
This reply was modified 4 years, 4 months ago by
scrambler.
February 7, 2021 at 5:53 pm in reply to: New with a couple of questions on the Vue gen 2 and its App #6853 Report Abusescrambler
MemberI will add the answers I got from support chat
Gen 2 measures true Voltage and phase (PF) to calculate power. It apparently self detects which CT is on which leg during setup.
These data may be available in the download in future releases
February 6, 2021 at 4:01 am in reply to: How to reboot, the app won’t connect after router reboot #6821 Report Abusescrambler
MemberI am just reporting what I was told, and have not had a chance to verify it yet. But I have dual monitoring on grid import export, so eventually I wioll be able to do that and can confirm either way.
February 5, 2021 at 11:38 pm in reply to: How to reboot, the app won’t connect after router reboot #6810 Report Abusescrambler
MemberI was told by Emporia, that although the Vue Gen 2 can only store 5 to 15mn data, if it looses connection for more than that, it still keeps track of the overall consumption and will fill in the missing data with the average between the moment it lost connection and the moment it reconnects (showing a flat consumption level).
This means that although you would not see the actual consumption fluctuations for the period connection was lost, the overall consumption number should be correct.
-
This reply was modified 4 years, 4 months ago by
scrambler.
February 1, 2021 at 8:24 pm in reply to: Can I combine two CT sensors into one Vue port? #6779 Report Abusescrambler
MemberIdeally what would be better and easier, would be to be able to group loads in the App, so that at the top level they would show as a single loads and total value.
Then have a down arrow next to the Group and when clicking on that, expand the group to show all the individual loads in the group.
Like that you can both see the group as a single load, but you can always access the details if needed (like for troubleshooting)
-
This reply was modified 4 years, 3 months ago by
-
AuthorPosts
